
Working Together To Collect Wisconsin Water Quantity Data
Department of Natural Resources - Water Use Section
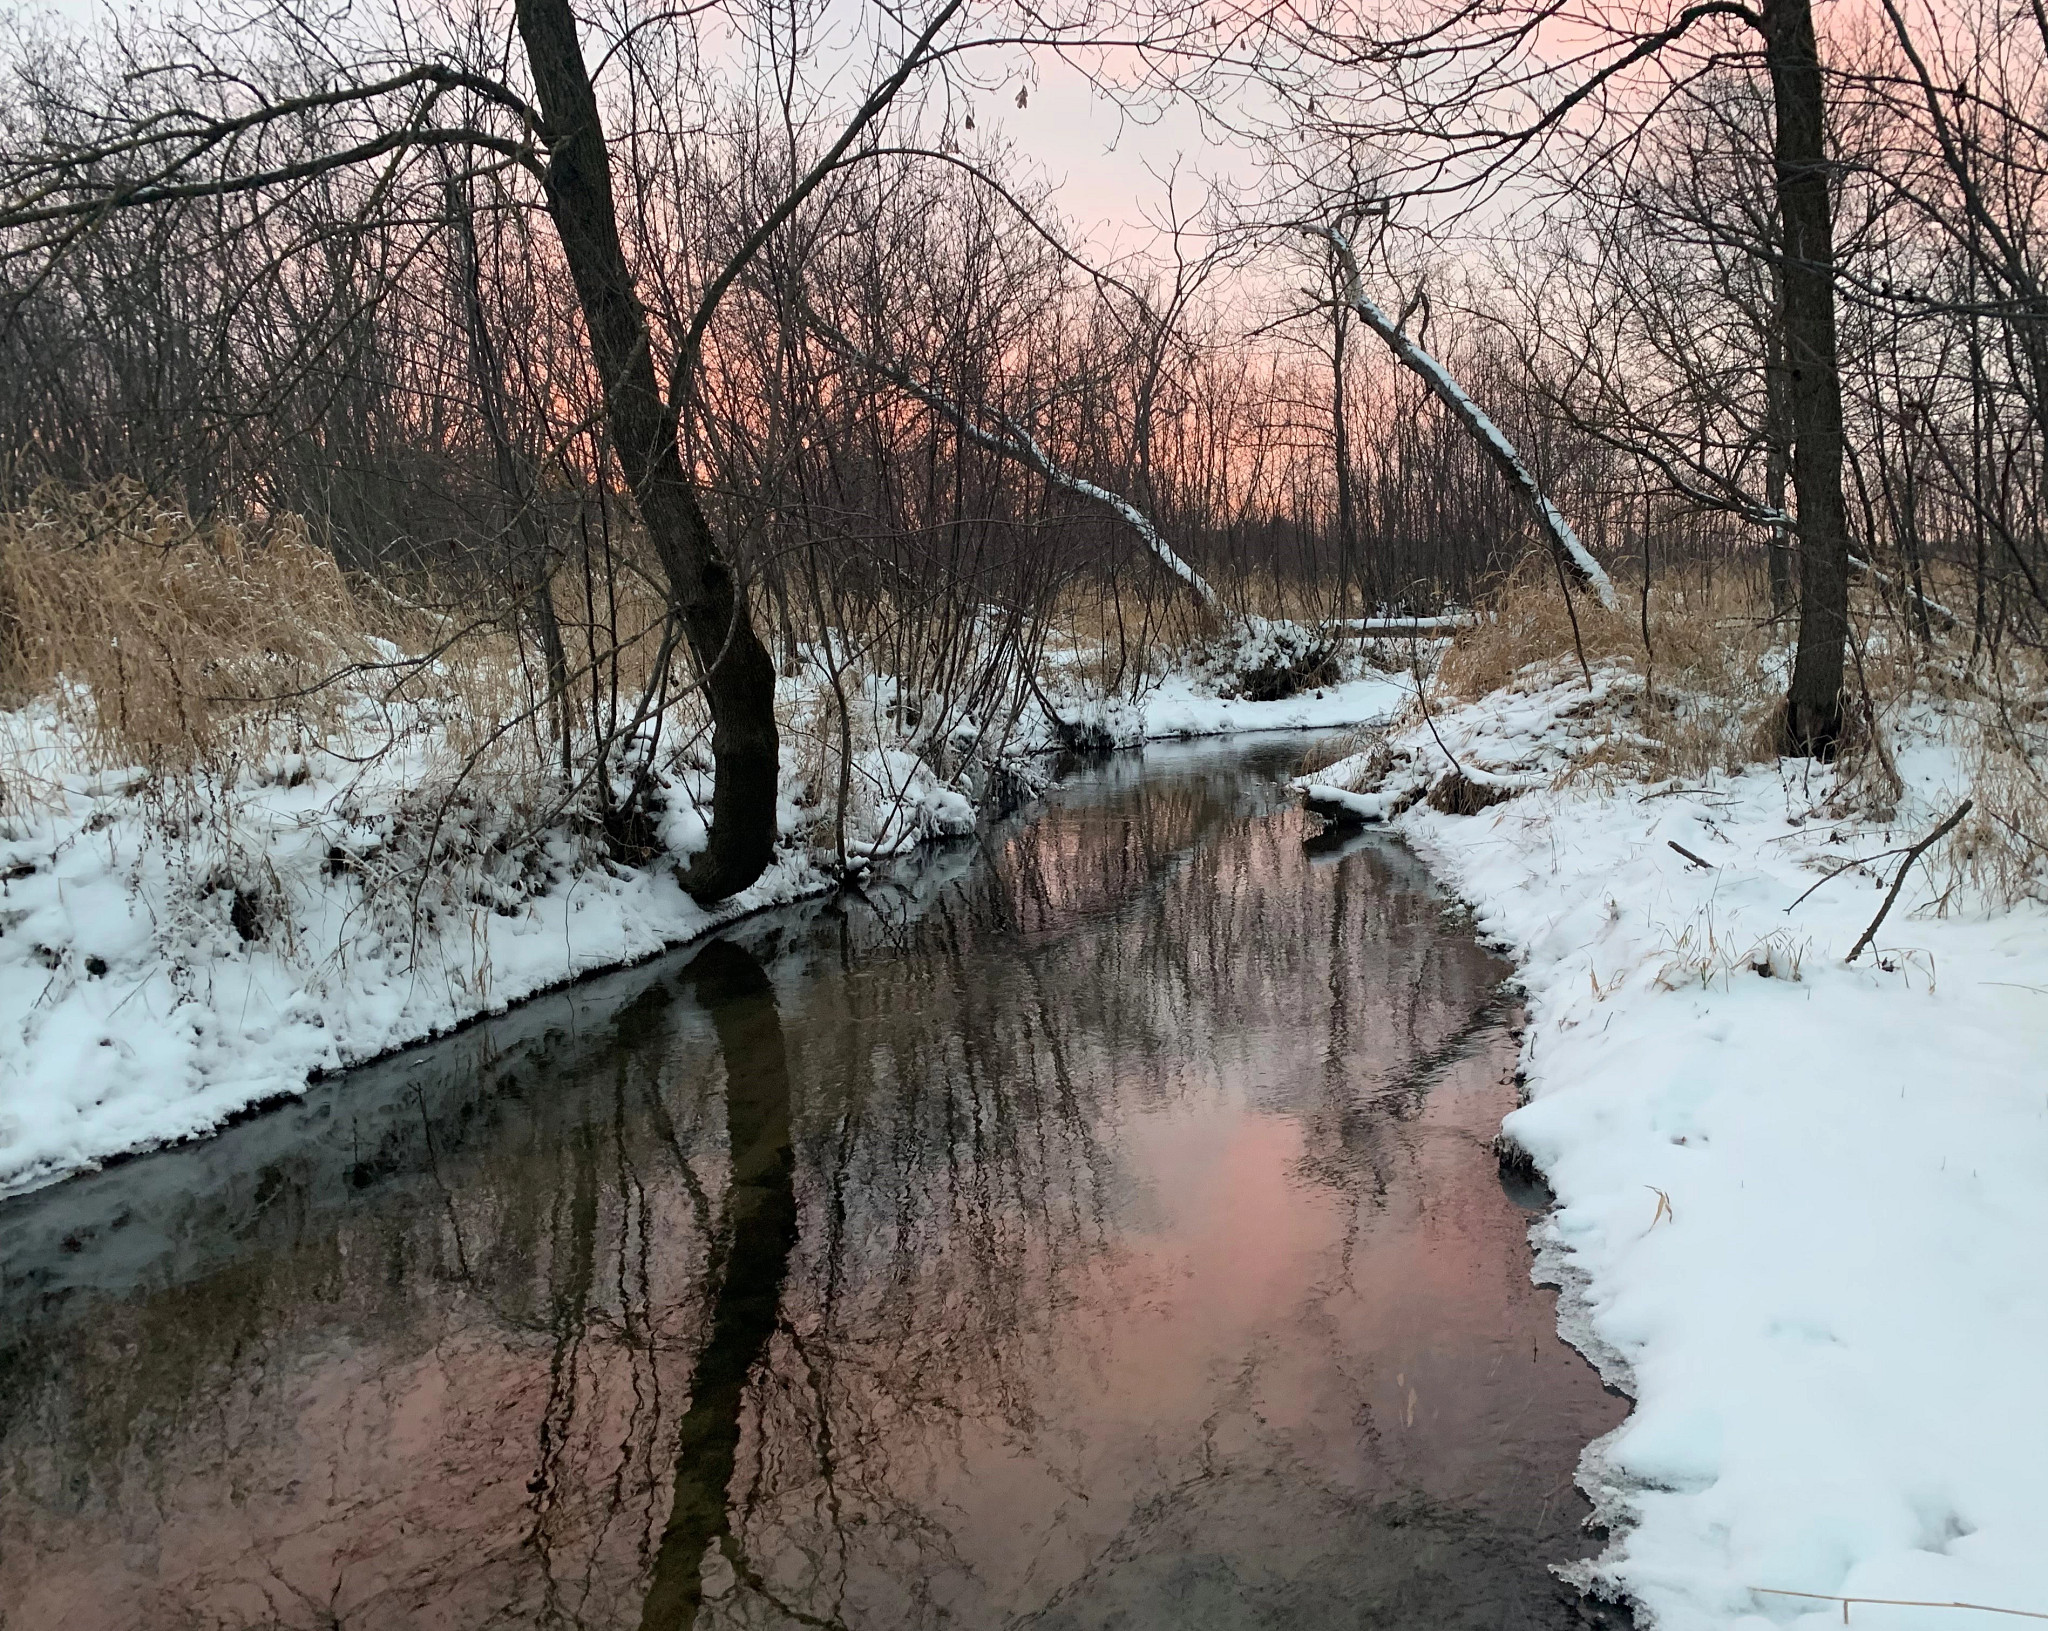
Water Quantity in Wisconsin
Wisconsin has plentiful lakes, rivers, streams, springs and groundwater, but our water resources are not always equally distributed or used similarly across the state.
The Wisconsin DNR uses water quantity data, such as streamflow and water levels, to understand the relationship between groundwater and surface water; to ensure sustainable water supply for human consumption, healthy ecosystems and economic growth; and to support sound resource management decisions. We believe sustaining and protecting Wisconsin’s water resources are critical components of natural resources management.
The DNR and our partners monitor water quantity by measuring the levels of groundwater and lakes, along with the flows of our springs, streams and rivers. We track water quantity levels through Wisconsin's Water Quantity Data Viewer .
Keep reading for highlights of the DNR's work on monitoring water and our partnerships with other agencies, organizations and volunteers to support the DNR's mission and requirements to inventory Wisconsin’s water resources as part of the Great Lakes Compact .
Groundwater Levels
Wisconsin Groundwater Monitoring Network
We use groundwater level data, such as groundwater elevation or depth to groundwater over time, to help us understand local water resources. The data are also used to assess drought and flooding conditions; calibrate groundwater flow models and decision-support tools; evaluate land-use changes; and determine the relationship between water resources and withdrawals.
The Water Use Section provides annual funding, through water use fees , to support Wisconsin’s Groundwater-Level Monitoring Network . While groundwater levels have been monitored in Wisconsin for over 100 years, a formal monitoring network was established in 1946. It grew to about 270 wells in the 1950s. Currently, this network has about 100 wells across the state. The goal of the network is to maintain groundwater monitoring wells to determine trends in water levels across the landscape and through time.
Network Well Locations
The DNR manages this network with the United States Geological Survey (USGS) and the Wisconsin Geological and Natural History Survey (WGNHS). USGS monitors the wells, checks the well data and uploads it to the National Water Information System. Additional groundwater level monitoring wells exist throughout the state to provide insight into groundwater flooding and more significant projects like the Central Sands Lakes Study . See the Water Quantity Data Viewer for short-term project wells.
Check out this video on the WGNHS webpage about Wisconsin's Groundwater-Level Monitoring Network .
Map Tour of the Wisconsin Groundwater Monitoring Network
01 / 05
1
E. Helgeson Well, Vernon County, Wisconsin
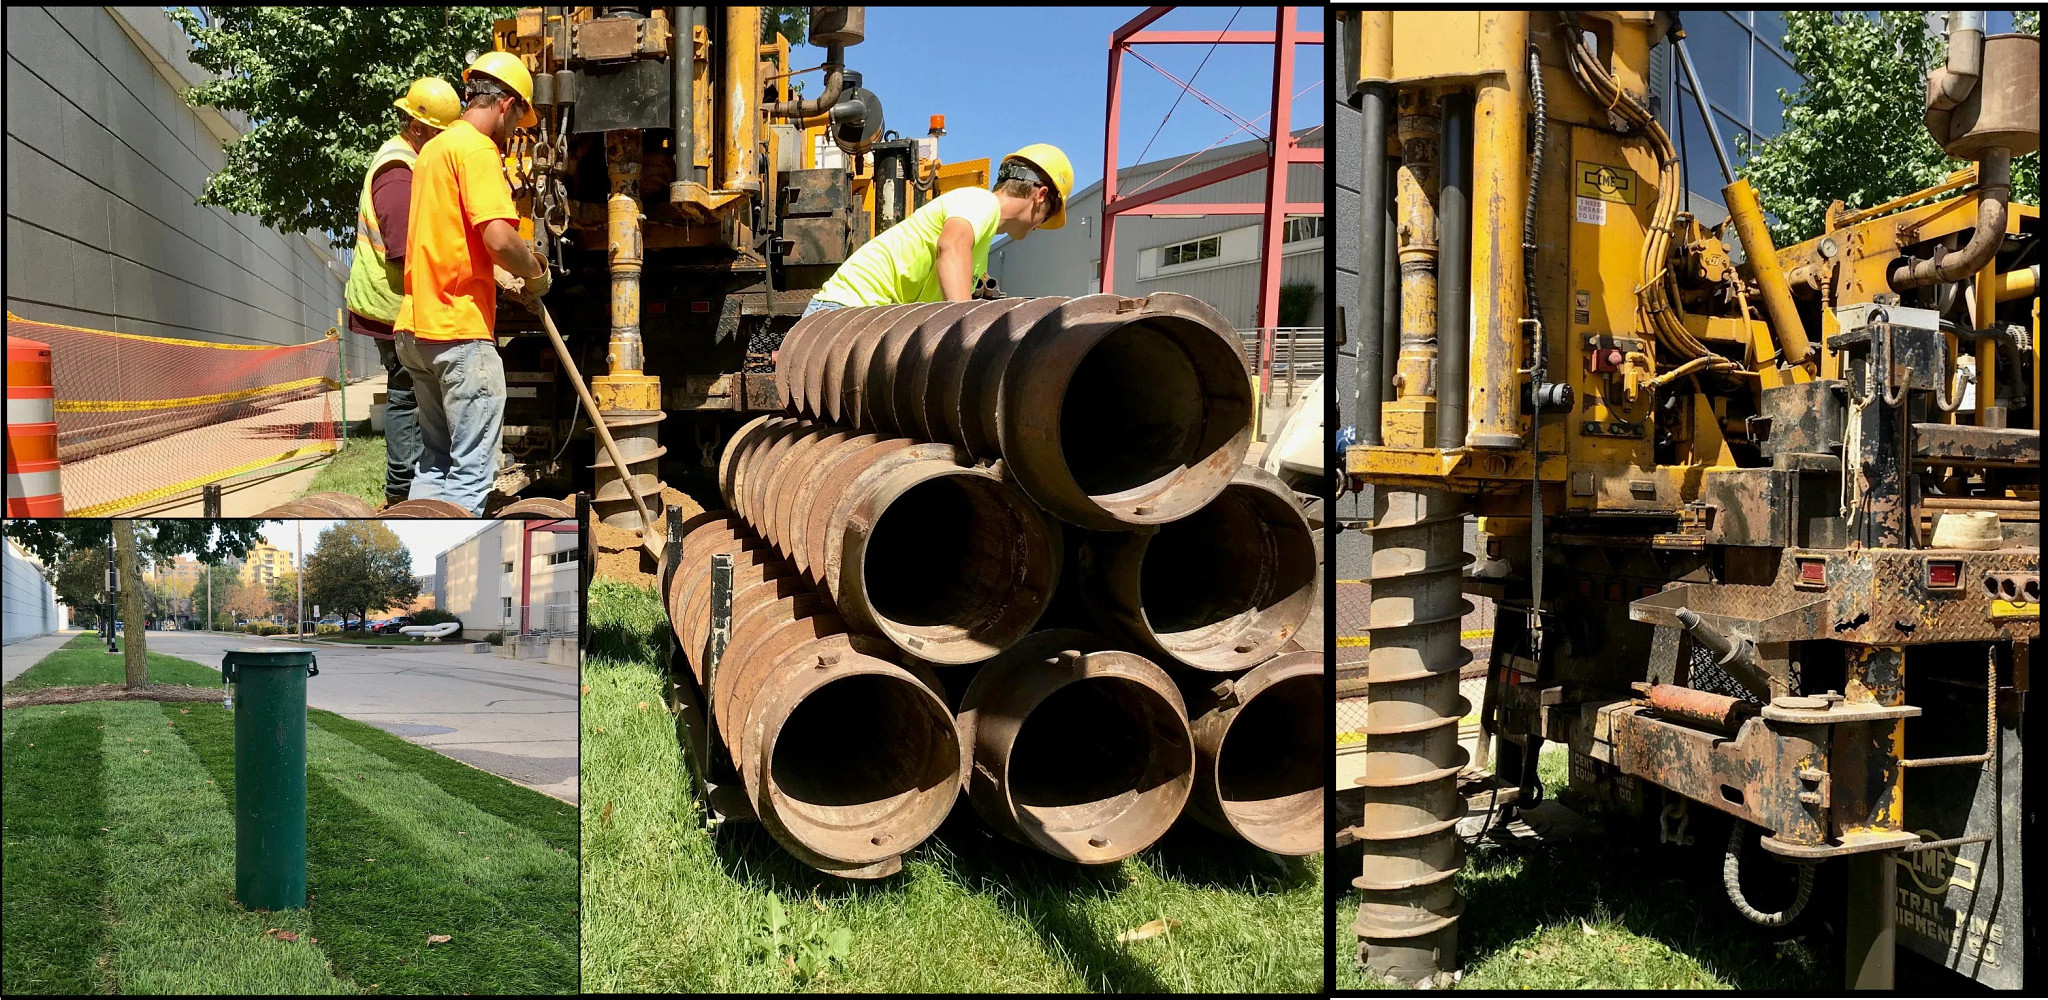
The Vernon-08 well (left photo, USGS ID 433928091102501 ) was one of the first wells in Wisconsin installed to monitor groundwater in the Cook Creek Area of Vernon County. This well was installed in June 1934 to take periodic groundwater measurements as part of the U.S. Conservation Soil Service – currently known as the National Resource Conservation Service (Zaporozec, 1982).
Due to safety, compliance, and accessibility issues (wooden well structure), a new well, Vernon-410 (right photo - USGS ID 433931091103501 ) was drilled nearby to continue supporting this long-term data record. We are grateful for the private property owners that partner with us to host wells.
2
Wisconsin State Capitol Well, Dane County, Wisconsin
With funding from the USGS National Groundwater Monitoring Network program, the WGNHS and USGS repaired and evaluated DN-05 (USGS ID 430429089230301 ) in 2020. This well has a unique history, as it is located in the basement of Wisconsin’s State Capitol building. This well's record goes back to 1874, when USGS recorded the groundwater elevation. This well was originally outside of the second Capitol building in Madison. This well may have been used for public water supply; however, by 1896, the Capitol received drinking water from a reservoir near the University (source: Wisconsin Historical Society).
After the current Capitol was built (1906-1917), this deep well likely was used in a refrigerating plant to provide ice water to drinking fountains ( Isthmus 2017 ). We recently measured this well 34 feet below the land surface. This well provides long-term data on the sandstone aquifer and water quantity for Dane County.
3
Havenwoods State Forest Well, Milwaukee County
Many of the original wells in the statewide network were on private property. As landowners change, well access for operation and maintenance can become complicated, causing a need to drill replacement wells. To ensure the continuation of long-term water-level monitoring and reliable well access, we try to establish replacement wells on nearby public lands. The DNR recently moved one well from private to public lands in Milwaukee. The private well, MKE-118 (USGS ID 430706087583601 ), had data measurements since 1946.
We drilled a new well at Havenwoods State Forest MKE-8035 (USGS ID 430742087581102 ). We measured both wells concurrently to establish an overlapping water-level record before removing MKE-118 from the long-term network.
The graphic to the right shows a cartoon version of a cross-section of one of our monitoring wells. We capture water levels on a water level sensor. Then, USGS downloads the data and uploads it to the USGS website . Visit Havenwoods for a hike and see our educational sign promoting the groundwater network.
4
New Green Bay Water Utility Well, Brown County, Wisconsin
Another example of long-term wells capturing trends is the network of wells in the state's northeast region. Researchers from UW-Green Bay and WGNHS use these wells to look at trends in the aquifer used for drinking water in the Fox River Valley. One well, BN-7 (USGS ID 443228088003101 ), was drilled in 1926 and monitored as part of the network from 1950 until 2019.
This well was located on private property in a power plant basement, which has now been abandoned. However, this well's historical record was vital to capture the drawdown of the aquifer that served as the drinking water supply for the City of Green Bay and surrounding communities before the City of Green Bay switched to Lake Michigan for potable water in 1957. The well showed a steady downward trend from the 1960s to the early 2000s until more surrounding communities were hooked up to Lake Michigan water. The upward trend is the rebound, or rise, in the aquifer. The WGLMN network has partnered with Green Bay Water Utility to use BN-9 (USGS ID 443035088045501 ) to continue monitoring this aquifer.
5
Websters Well, Burnett County Wisconsin
The Webster well, BT-02 (USGS ID 455224092215601 ), provides one of the longest well records in northern Wisconsin and the state. With data reaching back to the late 1930s, we have used this well in many groundwater-availability projects, including a recent assessment of groundwater flooding in Burnett Counties. As a result of the dustbowl era of the 1940s and 1950s, our partners installed many monitoring wells as irrigated agriculture became more common.
Spring Flows
Wisconsin Spring Flow Monitoring
Springs represent the interface between groundwater and surface water. Springs are a critical natural resource, supplying water for streams and wetlands. When we measure spring flow volume and water chemistry, it helps us understand the groundwater and surface water relationship.
Springs can be described by how they emerge and their hydrogeologic properties. There are three main types of springs in Wisconsin:
- Rheocrene Spring – springs that naturally discharge to a stream channel
- Hillslope Spring – emerge from a steep slope and may form a stream channel
- Limnocrene Spring – emerge and discharge directly to a lake
The use of spring water has a rich history in Wisconsin. From Wisconsin's indigenous peoples and early settlers to now, the uses for springs are varied: fish rearing, swimming, milk and beverage storage, livestock watering, and food and drink manufacturing.
An old foundation is pictured on the left, built directly over the spring water discharge. The right photo shows a wide spring boil pattern that discharges into a private trout pond.
The DNR, the Wisconsin Geology and Natural History Survey and Beloit College monitor springs around the state. The springs inventory (green circles) consists of over 450 springs monitored over a 10-year rotation. However, we have designated seven reference springs (yellow stars) across the state and monitor each reference spring four times a year.
We measure springs using cfs or cubic feet per second and we are most interested in springs that flow above 0.25 cfs.
Scroll down to tour the reference springs.
Reference Springs Map Tour
01 / 08
1
Highland Big Springs, Iowa County, Wisconsin
Highland Big Springs is a must-visit-resource located outside of Highlands Wisconsin. This hillslope spring cascades around thirty feet into the Big Springs Branch of the Blue River from a single Limestone orifice. The average flow for Highlands Big spring is 3.2 cfs or 1,440 gallons per minute.
2
Pine Creek Spring, Pierce County, Wisconsin
Pine Creek is located in Maiden Rock Township, Pierce County, in the northwestern Driftless Area. Pine Creek originates from many springs at the base of bluffs along the Mississippi River and flows directly into the Mississippi near Lake Pepin. Pine Creek has good water quality but severe stream bank erosion, similar to many streams in the Driftless Area. Pine Creek Spring’s average flow is 1.4 cfs or 630 gallons per minute.
3
Kelly Spring, St. Croix County, Wisconsin
Kelly Spring, a spring under limestone outcropping, is at the headwaters of Kelly Creek which flows into the main branch of the Kinnickinnic River. The average flow of the spring is 1.1 cfs or 495 gallons per minute which helps sustain cool temperatures for Brown and Brook Trout in Kelly Creek. The three pictures depict the spring outlet in winter, spring and summer.
4
Sajdak Spring, Bayfield County Wisconsin
Sajdak Springs, part of the DNR’s Sajdak Springs State Natural Area, features a series of soft water springs originating from a north-facing moraine and feeds a small trout stream. This stream flows into the White River, which flows north to Lake Superior. The springs originate under a variety of trees, including second-growth aspen, maples, and cedars. The average flow of Sajdak Springs from 2015 to 2022 was 1.2 cfs or 540 gallons per minute.
The left image shows where Sajdak Springs discharges in summer. The right picture is the flow from Sajdak Springs in the fall.
5
Pine River Spring, Waushara County, Wisconsin
The Pine River Spring feeds the Pine River, which provides high-quality habitat for trout within Wisconsin's Central Sands region. The sandy stream bottoms and cool, crystal waters within the Pine River watershed are essential for the local fishery. The surrounding area includes known archeological sites, burial mounds and campsites. The average flow of Pine River Spring was 1.4 cfs or 63 gallons per minute between 2015 and 2022. You can see the sandy bottoms of the characteristic Central Sands streams in the picture.
6
Three Springs, Door County, Wisconsin
Near Baileys Harbor in Door County, Three Springs is part of the Three Springs Nature Preserve that encompasses approximately 17,000 acres of wild Lake Michigan-coastal land. Three Springs and the creek that flows through the property provide a unique habitat for endangered and threatened species. The average flow of Three Springs was 1.9 cfs or 855 gallons per minute between 2015 and 2022.
7
Scuppernong Spring, Waukesha County, Wisconsin
Scuppernong Spring includes several small springs located just south of Oconomowoc. This site is a popular destination for family outings, outdoor enthusiasts and school groups because the trail and springs area sit in a bowl-shaped depression where the water table reaches the surface. The spring water flows on average at 1.5 cfs or 675 gallons per minute. The water has a constant temperature of 47° F and forms an everchanging sand boil pattern. You can see more bubbling springs along the Scuppernong Springs Nature Trail.
8
Lodi Marsh Spring, Dane County, Wisconsin
Lodi Marsh Spring is within the Lodi Marsh State Natural Area. This low-lying marsh is in a narrow valley filled with glacial till with numerous springs. Lodi Marsh Spring makes up the headwaters of Spring Creek and had an average flow from 2015 to 2022 of 2.5 cfs or 1125 gallons per minute.
Stream and River Flows
Wisconsin's Streams and Rivers
Wisconsin has about 32,000 miles of streams and rivers that flow continuously. These streams and rivers support fish and aquatic life, recreation, wildlife and public health. Many of these streams and rivers depend on baseflow. Baseflow is the flow in the stream that originates from groundwater rather than water that enters the stream from rainfall and runoff. The groundwater contribution is the dominant source of water for the majority of Wisconsin’s streams and rivers ( Gebert, Walker, and Hunt 2009 ).
We examine changes in baseflow - especially to Wisconsin's headwater streams, trout streams and Outstanding and Exceptional Resource Waters to provide clues to how groundwater level changes may be influencing the stream’s water levels. For example, depleted baseflow in streams can lead to higher temperatures and a lack of fish and aquatic life habitats.
Across Wisconsin, DNR staff collect instantaneous streamflow measurements year-round. In addition to the data that DNR staff collect, we use data from various agencies, universities and volunteers when examining changes in streamflow.
All streamflow data are entered into SWIMS and can be found on Wisconsin’s Water Quantity Data Viewer under DNR Water Quantity Monitoring: Baseflow Data.
UWSP Central Sands Streamflow
Since 2005, the DNR has collaborated with the University of Wisconsin-Stevens Point Center of Watershed Science (UWSP) to collect monthly streamflow at approximately 40-50 locations. UWSP identifies acceptable field conditions for baseflow measurement by referring to recent rainfall and surrounding USGS streamflow gage records.
UWSP also trains volunteers and county staff to collect baseflow data. UWSP staff additionally collect duplicate measurements for quality assurance purposes.
UWEC Western Wisconsin Streamflow
In 2019, the DNR began working with the University of Eau Claire’s (UWEC) geology department to establish a program in west-central Wisconsin. UWEC staff and students were trained to measure streamflow to gather long-term baseflow measurements in this part of the state and give students hands-on experience.
The students visit approximately 18 sites monthly and use a wading rod, tagline and flow meter to grab instantaneous flow measurements. The DNR installs pressure transducers to develop long-term stage/flow relationships at some locations.
USGS Gage Sites in Wisconsin
The DNR partners with the United States Geological Survey to fund continuous flow monitoring across the state by installing gages on streams and rivers. The USGS continuous flow measurements provide real-time flow data.
Continuous flow data can provide stream levels in response to precipitation, nearby water withdrawals, runoff and baseflow conditions. This long-term, continuous data can provide the information needed to calibrate flow models for larger projects, such as the Central Sands Lakes Study .
USGS Gage Sites
The DNR Water Use Section continues to funds five stream gages (Tomorrow River, Little Plover River, Chaffee Creek, Big Roche Cri River and S. Branch of Tenmile Creek) in the Central Sands to understand the long-term interconnectedness between lakes, streams, and groundwater.
The picture here is the USGS stream flow gage on Chaffee Creek in Waushara County.
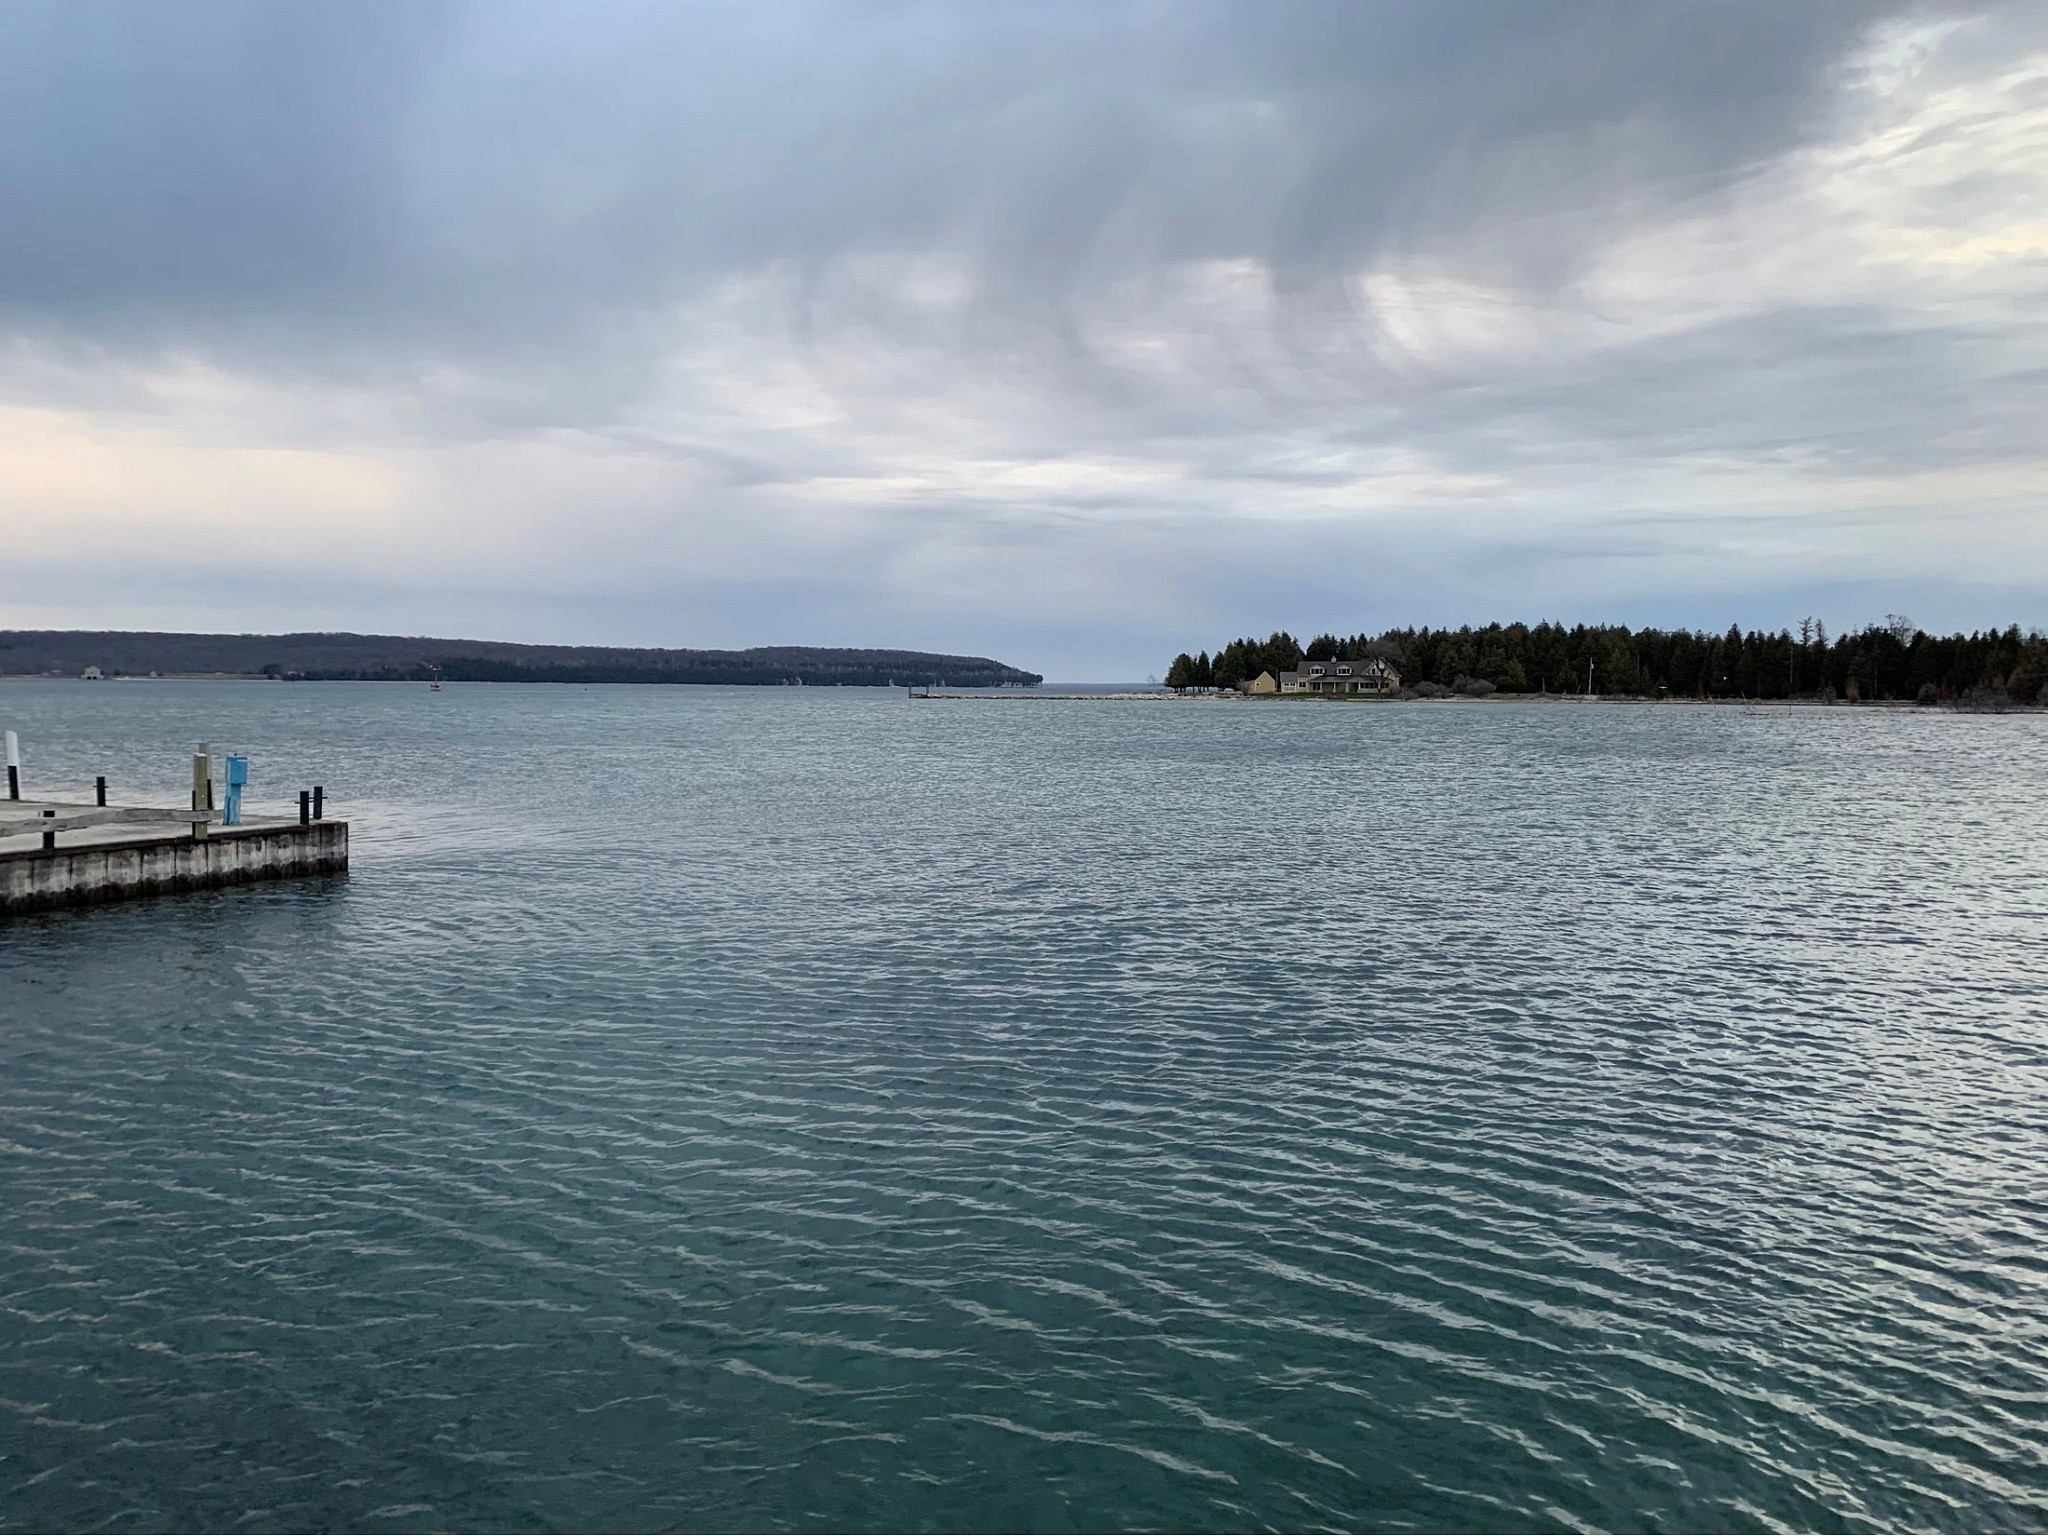
Lake Level Monitoring
Wisconsin Lake Levels
Wisconsin has approximately 15,000 lakes. Most of these lakes are directly or indirectly connected to the groundwater system, meaning some portion of the lake’s water level is dependent on groundwater. Lake water levels can fluctuate naturally due to precipitation, which varies widely from season-to-season, year-to-year and across the state. However, recent studies show that groundwater withdrawals can impact levels beyond a lake’s natural fluctuation.
Multiple agencies, universities, conservation groups, volunteers, and the DNR have measured lake levels since 1918. There are three primary methods for measuring lake levels throughout Wisconsin: pressure transducers, staff gages, or stilling wells.
Most commonly, we use staff gages to measure lake level fluctuations. However, staff gages need to be professionally surveyed during installation in spring and during removal in fall due to winter ice. Surveying the elevation of the staff gage allows us to convert the raw staff gage readings to feet above sea level or elevation relative to a permanent reference point on shore. This makes lake levels comparable year-to-year.
In areas such as the Central Sands, where the local geology is sand and gravel, we may monitor stilling wells (piezometers) near the lakeshore as indicators of lake levels. The DNR and our partners are testing newer technologies for the future, such as remote sensing, to develop even larger lake-level datasets. As measurement technology improves, we also see improved data accuracy and frequency.
Shown here are the difference in lake levels from the same location on Plainfield Lake during low lake levels (left, 2016) and high lake levels (right, 2019).
Wisconsin Lake Level Sites
The red triangles on this map represent sites coordinated by the DNR and supported by other agencies, non-profit groups and volunteer monitors. Our volunteers build and maintain staff gages and make weekly lake-level observations to better understand their local lake's behavior. County staff, and others, survey the staff gages each year.
If you’d like to learn more about monitoring lake levels, check out the DNR’s Citizen Lake Level Monitoring Program.
UW–Center for Limnology, Trout Lake Research Station
The Trout Lake Research Station is a facility located in Vilas County. This station, located in the Northern Highland Lake District, is a research hub for the UW- Center for Limnology . The research station has been supporting environmental opportunities, limnological research, training and outreach since 1925.
Their research collects long-term lake level data to understand further how lake levels impact lake characteristics and the effects of other environmental parameters, such as lake levels' impacts on habitat and local fish populations.
North Lakeland Discovery Center
The North Lakeland Discovery Center lake level project has engaged residents and interested youth to assist in monitoring around 40 lakes for over seven years. This program teaches the importance of using lake level as a metric to determine whether or not an ecosystem is healthy. Specifically, the center emphasizes engaging local riparian landowners to accurately measure lake levels in Vilas County.
Multiple agencies use the North Lakeland Discovery Center’s lake data to predict the effects of precipitation on lake levels and forecast the impact of changing groundwater flow on lake levels. The center uses various grants and pursues new grant opportunities to support lake-level monitoring efforts and other citizen science engagement.
The Central Sands Lakes Study
Recently the DNR and our collaborators completed the Central Sands Lakes Study – a look at how groundwater withdrawals impacts lake levels of Pleasant, Plainfield and Long Lakes in central Wisconsin. We used all the data described above to build a state-of-the-art groundwater flow model to answer the study's questions.
This included streamflow from UWSP and USGS gaging stations, lake levels from DNR and USGS, groundwater levels from the long-term monitoring network and project wells on private property. The study verified the connection between groundwater and lake levels and found groundwater withdrawals do impact lake levels throughout the Central Sands.
Additional Resources
DNR Water Use Section: Water Quantity Data Viewer
Wisconsin Geological and Natural History Survey: Springs StoryMap
The DNR will continue to monitor water levels across the state. We appreciate our partners, agencies, organizations, and citizens dedicating time and resources to monitoring water levels throughout Wisconsin.


