Landsat 7
Landsat 7 Celebrates Silver Anniversary on April 15, 2024.
Landsat 7 launched from Vandenberg Air Force Base in California on April 15, 1999, on a Delta II rocket. In April 2022, the satellite moved to a lower orbit to allow Landsat 9 to move into the same orbit as Landsat 8, but then continued to collect science data until January 19, 2024. During its lifetime, the Enhanced Thematic Mapper Plus (ETM+) sensor onboard acquired more than 3.3 million scenes of useful scientific information about the world’s landmasses.
This false color image of Sendai, Japan was captured by the Landsat 7 ETM+ bands 4, 3, and 2 on February 24 (Top) and March 12 (Bottom), 2011.
While the 2003 scan line corrector (SLC) failure removed 22 percent of the data and caused visible gaps in each scene going forward, the remaining 78 percent retained accurate geolocated and radiometrically calibration properties. The gaps caused by the SLC-off failure can be seen in these Landsat 7 images.
Hovering over Antarctica
The first-ever high resolution, true color map of Antarctica was built from more than 1,100 Landsat 7 images. The Landsat Image Mosaic of Antarctica (LIMA), released in 2007.
USGS worked with NASA, the National Science Foundation and the British Antarctic Survey to create the LIMA map. The map and the Landsat 7 scenes that make up the map provide everyone in the world a view of Earth’s highest, driest, coldest, windiest, and brightest continent.
LIMA is an international effort that supports scientific polar research, encourages new projects, and helps the public visualize Antarctica and changes happening to this southernmost environment.
Shown using a natural color composite (Bands 3| 2|1), LIMA covers the entire continent except from the South Pole at 90 degrees south to 82.5 degrees south latitude, where Landsat 7 has no coverage because of its near-polar orbit. LIMA and all the Landsat scenes used to make it are available for download at no charge.
This image includes McMurdo Station, the largest research base in Antarctica. Located at the tip of Hut Point Peninsula on Ross Island, McMurdo has been continually operated by the United States since 1956. Ross Island is roughly 72 km (45 mi) across. The flat, white areas are the Ross Ice Shelf and sea ice off the coast of Antarctica.
Deep Water Horizon
An explosion at an oil well in the Gulf of Mexico resulted in a major oil spill on April 20, 2010. Landsat imagery from May 1,2010, shows the extent of the oil slick. Landsat data were used to monitor the extent and movement of the slick in the months that followed.
Mangroves
Mangroves are hardy trees and shrubs that grow in the salty, wet, muddy soils of Earth’s tropical and subtropical coastlines. They protect the coast from erosion and storm damage; store carbon within their roots and trunks; and provide habitats for commercially important marine species.
Natural forces like erosion and extreme weather can lead to mangrove losses, but those natural losses come slowly compared to the damage caused by human activities such as farming and aquaculture. Conservation and resource managers need strategies to prevent loss or re-establish new habitats that account for natural and human-induced causes of loss.
This map shows the location and severity of mangrove habitat loss, measured in square kilometers, from natural and human drivers from 2000 to 2016. Countries colored orange and black had more mangrove loss from human causes, while those in purple had more losses from natural causes. The darker the color, the greater the area lost. The bar chart below shows those losses broken down by regions and by 5- and 6-year increments.
Between 2000 and 2016, habitat losses from both natural and human causes declined, but losses from natural events like erosion and storms declined more slowly than those caused by humans. In some cases, this was due to successful conservation efforts. In others, there were no mangroves left to lose.
Below are stories from Landsat 7 or that Landsat 7 contributed data. Use the map to explore locations near you!
The Dead Sea, Over Time
Aral Sea, Over Time
Mount St. Helens
Larsen Ice Shelf
Extensive Flooding in British Rivers
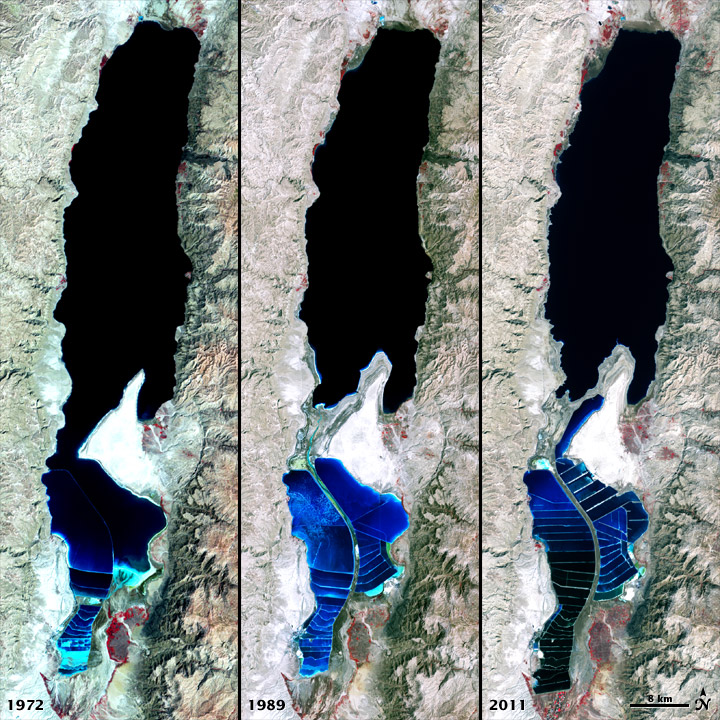
The Dead Sea, Over Time
The Dead Sea is so named because its high salinity discourages the growth of fish, plants, and other wildlife. This salt lake resides in a depression in the Earth's crust, where the continents of Africa and Asia pull away from each other. The Dead Sea is the lowest surface feature on Earth, sitting roughly 1,300 feet (400 meters) below sea level. On a hot, dry summer day, water levels can drop as much as one inch because of evaporation.
The false color images above were captured by Landsats 1, 4, and 7. Landsat 1 acquired the first image on September 15, 1972. The second was acquired on August 27, 1989, by Landsat 4; The third by Landsat 7 on October 11, 2011.
All three include a combination of near-infrared, red, and green wavelengths. Deep waters are blue or dark blue, while brighter blues indicate shallow waters or salt ponds (in the south). The pale pink and sand-colored regions are barren desert landscapes, while green indicates sparsely vegetated lands. Denser vegetation appears bright red. Near the center is the Lisan Peninsula, which forms a land bridge through the Dead Sea.
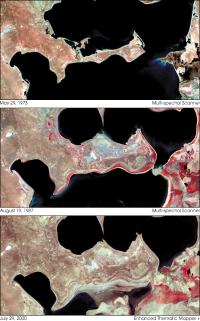
Aral Sea, Over Time
The Aral Sea was once the fourth largest lake in the world. Situated in an otherwise desert region of Kazakstan and Uzbekistan, two rivers, the Syr Darya and the Amu Darya, carried snowmelt and rainfall from distant mountains to where they pooled in the Aral Basin. The Aral Sea supported farming in the river deltas and a fishing industry up through the first half of the 20th century.
Then in the 1960s, the Soviet Union converted the local economies to cotton production and diverted the two rivers to irrigate the fields. With no other major source of water, the Aral Sea has been evaporating and shrinking ever since. After fifty years, the lake holds just ten percent of the volume it held in the 1960s.
Mount St. Helens
The 1980 eruption of Mount St. Helens — which began with a series of small earthquakes in mid-March and peaked with a cataclysmic flank collapse, avalanche, and explosion on May 18 — was not the largest nor longest-lasting eruption in the mountain’s recent history. It was significant, however, as the first eruption in the continental United States to occur in the era of modern scientific observation.
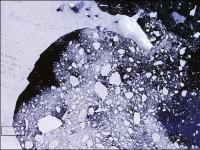
Larsen Ice Shelf
Warmer surface temperatures over just a few months in the Antarctic can splinter an ice shelf and prime it for a major collapse, NASA and university scientists report in the latest issue of the Journal of Glaciology.
Using satellite images of tell-tale melt water on the ice surface and a sophisticated computer simulation of the motions and forces within an ice shelf, the scientists demonstrated that added pressure from surface water filling crevasses can crack the ice entirely through. The process could become more widespread if Antarctic summer temperatures increase.
This true color image from Landsat 7, acquired on February 21, 2000, shows pools of melt water on the surface of the Larsen Ice Shelf, and drifting icebergs that have split from it. The first image is an overview of the shelf’s edge, while the second image is displayed at full resolution of 30 meters (98 feet) per pixel. The labeled pond measures roughly 1.6 by 1.6 km (1.0 x 1.0 miles).
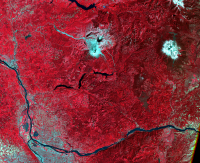
Extensive Flooding in British Rivers
In November 2000, rain poured into the United Kingdom, bringing more water to an already waterlogged landscape. Some rivers there are seeing their worst flooding in more than fifty years. Of note, Britain's River Ouse reached its highest levels on record since 1625.
Thousands evacuated the month prior when a large low-pressure system brought torrential rains and hurricane-force winds, placing regions around more than 40 rivers across the country on flood alert. The rains have persisted for another three months, keeping water levels high and causing additional rivers to overrun their banks.
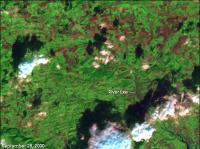
These Landsat 7 scenes show a comparison of the region surrounding Exeter, England, before and after the floods. The first image was acquired September 28, 2000, and the second image was acquired October 30, 2000. Note the extensive flooding along the River Exe in the bottom image (blue pixels). The light bluish-white pixels in the first image are clouds, and the black splotches on the landscape are the clouds' shadows. The reddish-brown shapes are agricultural fields.
Visit the Landsat 7 Mission webpage to learn more about this mission.


