The Climate Planning Tool - Flooding Primer
Introduction
New Jersey is at risk from flooding, including coastal flooding made worse by Climate Change.
Climate change exacerbates coastal flooding in two ways.
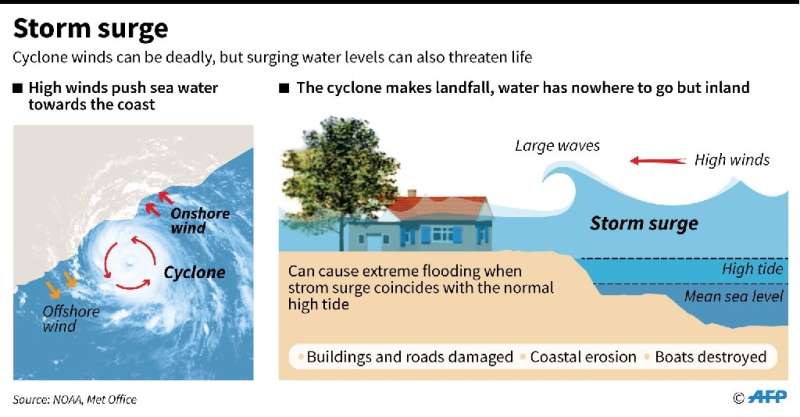
First, climate change puts more heat energy into the oceans, which then fuels stronger hurricanes and tropical storms. If these stronger storms reach the coast, they can cause larger storm surges than we've seen in the past. These storm surges can range in speed and depth ; in extreme cases people need to evacuate to higher ground.
Here's an illustration of how cyclones/hurricanes/typhoons cause storm surge:

image credit: https://phys.org/news/2019-05-storm-surge-dangerous.html
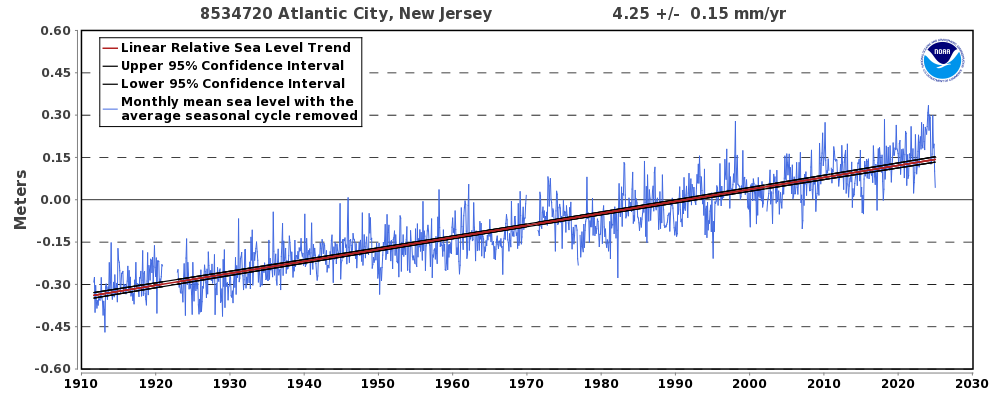
Second, climate change causes sea-level rise through two mechanisms: thermal expansion caused by warming of the ocean, and increased melting of land-based ice such as glaciers and ice sheets. Higher sea levels lead to more frequent nuisance flooding, and eventually permanent inundation of low-lying coastal areas.
Below, a graph of more than 100 years of Sea-level rise, measured at Steel Pier, Atlantic City :

Graphs for other National Oceanic and Atmospheric Administration (NOAA) Tide Stations (The Battery, Bergen Point-West Reach, Sandy Hook, Cape May, and Philadelphia) are available at https://tidesandcurrents.noaa.gov/sltrends/mslUSTrendsTable.html

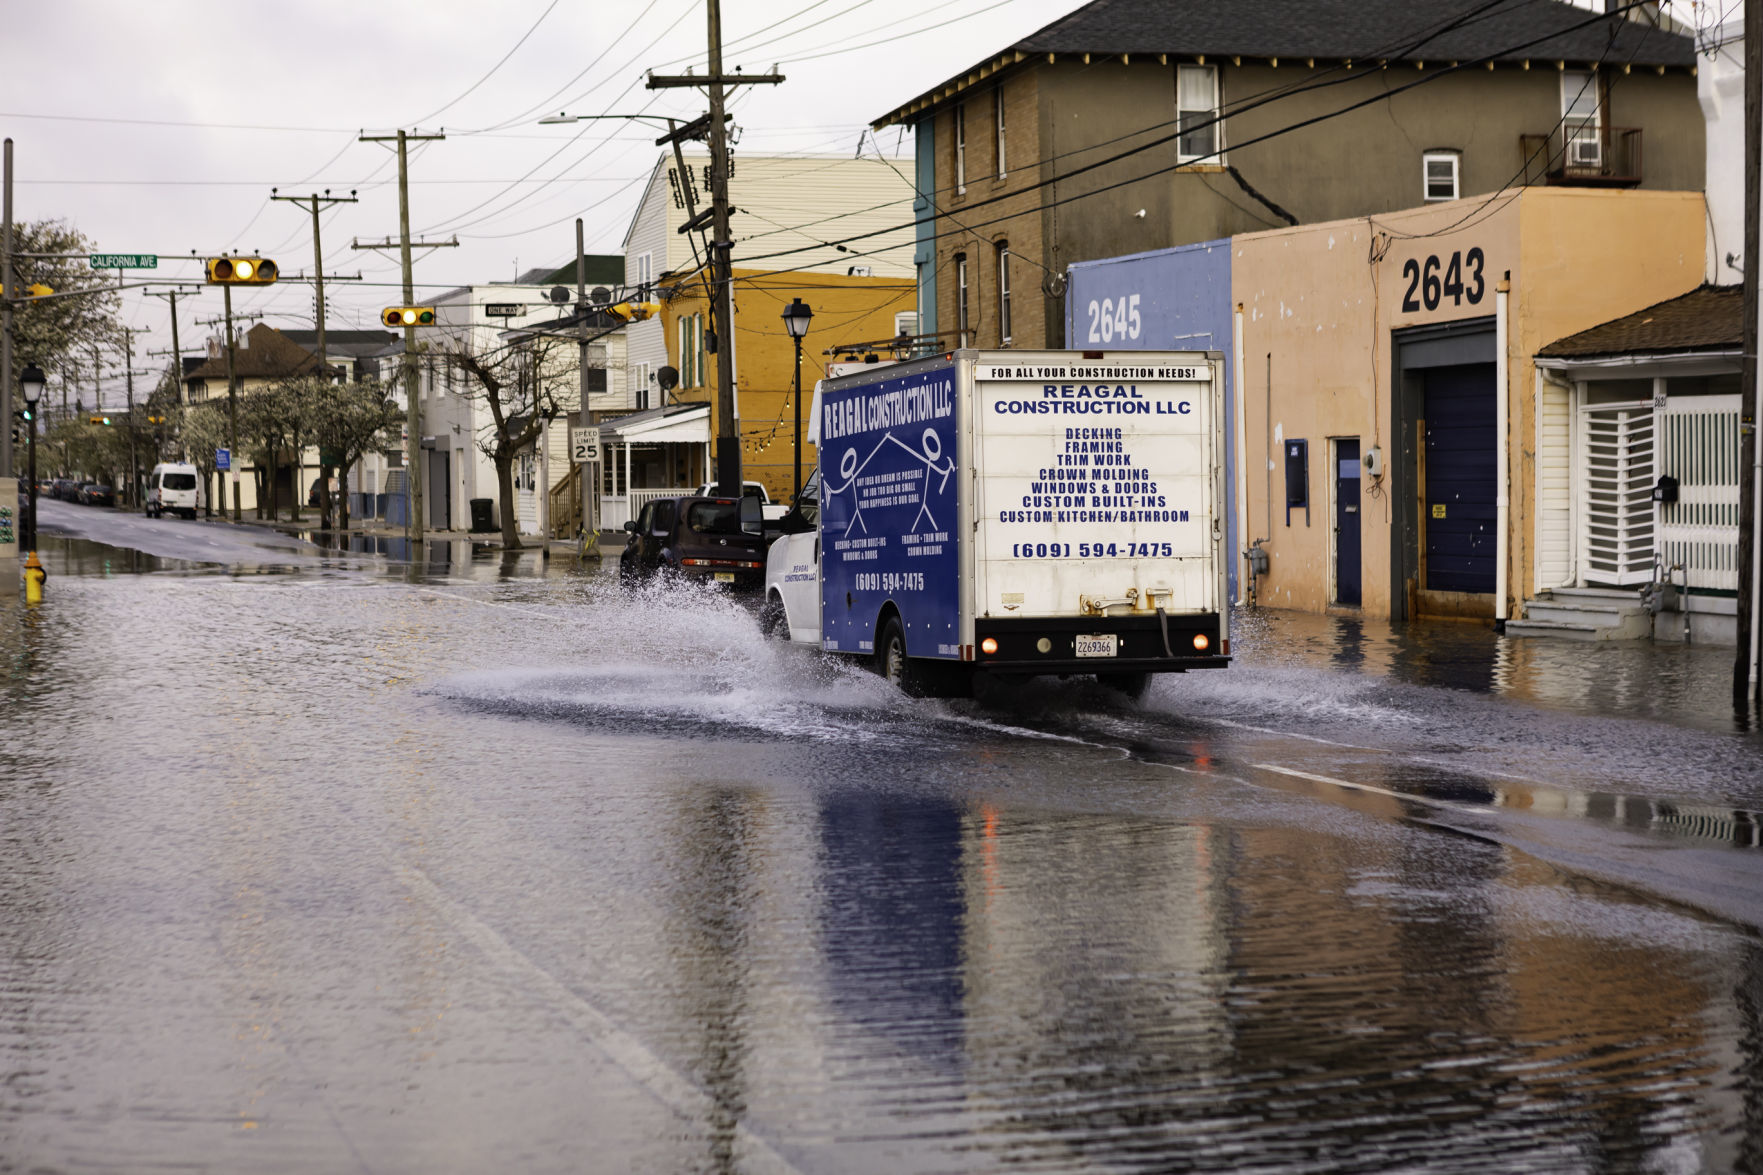
High Tide Flooding in Atlantic City, at the intersection of Fairmont & California Aves. 4/4/2020. (Photo credit: Kristian Gonyea/Press of Atlantic City )
These two effects of climate change can exacerbate one another: Higher sea levels give storm surges a boost in height, and stronger storm surges can erode coastal lands and make them flood more easily.
So, now we have an idea of what the hazards are. But how big might future floods be? How do we know what to prepare for?
Science and Planning
Scientists have been working on best-estimates for the hazards for storm surge, sea level rise, and high tide flooding.
First, let's consider Sea-level Rise, or SLR.
SLR
For a more thorough explanation, see the National Hurricane Center's 2016 blogpost by Robbie Berg on vertical datums
Because the sea level already moves due to wind and tide, the vertical reference we use is Mean Higher High Water, MHHW. It's an average of all the daily high tide levels -- to be more accurate, the higher of two daily high tide levels.
And we have detailed records of the tidal water levels thanks to continuous gauge stations like this one in Cape May .
So, let's see what comes out of the modeling process.
Besides Sea Level Rise, we also have to consider Storm Surges.
Storm Surge
Similarly to the sea level rise model, storm surges inundate the land based on terrain elevation and distance inland. However, unlike the gradual, permanent inundation of sea level rise, storm surges are violent and temporary.
To model the storm surge hazard, the National Hurricane Center created SLOSH, a computer model of Sea, Lake and Overland Surges from Hurricanes . SLOSH simulates a hurricane of known conditions. However, because nobody knows exactly what the next hurricane will be like, the National Hurricane Center simulated several thousand different hurricanes with different storm trajectories, forward speeds, and landfall locations and generated a composite of their surges. The largest surges are overlapped into Maximum Envelopes of Water (MEOWs), which are worst-case perfect storm models of where water will go for the whole coastline. Of course, a hurricane doesn’t hit the whole coastline directly all at once, so these models show what would happen if a hurricane directly hit any specific location.
Finally, there's High Tide Flooding.
HTF
According to Toolkit.Climate.Gov :
During extremely high tides, the sea literally spills onto land in some locations, inundating low-lying areas with seawater until high tide has passed. Because this flooding causes public inconveniences such as road closures and overwhelmed storm drains, the events were initially called nuisance flooding. To help people understand the cause of these events, they are now referred to as high-tide floods.
By definition, nuisance floods do not cause major property damage or threaten public safety. However, these floods nonetheless strain infrastructure: roadways, sidewalks and driveways become impassable, transit is suspended, and stormwater/wastewater systems do not drain/flush. Furthermore, nuisance flood conditions are conducive to pest insects, mildew, and microbes indoors or outdoors. Mosquitoes, for example, thrive in puddles of standing water.
The major concern, though, is that even occasional HTF events are increasing in frequency. Sandy Hook, for example, is expected to have 10-15 such floods per year at present, and 25-45 HTFs by 2030. In contrast, Cape May is expected to have 5-10 HTFs at present, and 15-30 by 2030.
(illustration credit: https://oceanservice.noaa.gov/facts/high-tide-flooding.html )
Click the "NOAA Tides & Currents" link below to see a map of Tide Stations. Then, click one to see the local water level threshold for High Tide Flooding, and the projected number of High Tide Flood days per year.
This is a major concern for coastal communities, especially in areas lining New Jersey's Back Bay area. As the problem increases, more towns are having to devote more resources to responding:
Total Water Levels (TWL)
These three different flood hazards -- SLR, Storm Surge, and HTF -- vary in their urgency, their permanence, and their predictability. Trying to model all three together is a complicated endeavor. That's why Rutgers University has developed its NJADAPT suite of tools using a Total Water Levels (TWL) approach to present a composite of flood hazard.
The use of water levels (as opposed to specific flooding or storm scenarios) allows us to discuss the variety of conditions that might cause flooding to reach a certain water level under a given set of assumptions. For example, flooding that is associated with a 1% storm is estimated to be approximately 7 feet above MHHW at Sandy Hook. Under a given set of assumptions regarding sea level rise, the same 7-foot water level is associated with a 99% storm (i.e. the Annual Flood) in 2100.
Put another way, we can treat floodwater levels as eventual conditions that will happen sooner or later, instead of at specific planning horizon years. For example, the occasional 3-foot storm surge of today may be the same water level as the HTF of 2030. The 2-foot HTF of today may be the same water level as the new-normal sea level of 2070.
By using Total Water Levels instead of specific years, we can bypass the uncertainty from projecting future climate effects. Rather than be concerned about distinguishing whether a floodwater level of, say, 7 feet will become a threat in the year 2050 or in the year 2100, we can simply acknowledge that sooner or later, this floodwater level will happen, and plan accordingly.
TWL benchmarks
So, what water levels should we plan for? Here are some scenarios based on the best available science, followed by administrative guidance that employs these water levels.
- 2 feet of water approximately represents current High Tide Flooding. The seven NOAA gauges along New Jersey's coastal/tidal zone ( starting from The Battery, down the shore, then up the Delaware River to Philadelphia ) indicate an HTF threshold between 1.82 and 1.91 feet.
- 3 feet of water represents the typical Nor’easter surge that occurs today (in contrast to more extreme Nor'easters ). Over the long-term future, it is projected that high tide each day could meet or exceed this water level under both Moderate and High Emission likely scenarios.
- 5 feet of water not only represents the sum of the above, i.e. a Nor’easter during a high tide flood, but also currently corresponds to roughly the 100-year flood ( 1% AEP ). In the future, depending on sea level change conditions, this water level may become the 10-year flood (10% AEP) by 2040, or the annual/HTF flood event by 2100.
- 7 feet of water currently represents a 500-year event. In the future, under certain sea level change conditions, this water level can become the annual flood event (99% chance of at least one event in a given year) between 2070 and 2100.
- 12 feet of water has not currently been experienced in most of New Jersey. This water level is equivalent to a future 100-year storm and allows the plan consultant team to consider the risk of what would occur under future conditions for a hurricane. Under a Moderate emissions high-end scenario, this event threshold is likely to be surpassed between 2070 and 2100, but under Likely scenarios, the threshold would be exceeded shortly after the end of the century.
The New Jersey Office of Planning Advocacy’s (NJOPA) Oct 2020 Municipal Plan Endorsement guidelines require that “Communities assess flood risks that at a minimum identifies areas within the municipality that are subject to exposure to 3-, 5-, and 7-foot of sea-level rise and the 1% (100-year) and 0.2% (500- year) storms as part of the Municipal Self-Assessment.”
The New Jersey Department of Environmental Protection's (NJDEP) June 2021 guidance document on Sea Level Rise makes the recommendation to “utilize 2100 as a planning horizon” . This horizon includes four of the water levels mentioned directly above (2, 3, 5, and 7 feet).
When we include NOAA's high tide flooding estimates of ~0.57 meters (1.8-1.9 feet), we can settle on using our standard Total Water levels, informed by the state's science & technical advisories, and the state's published guidance:
- 2 feet
- 3 feet
- 5 feet
- 7 feet
Next: GIS Steps for Flood Analysis