
Flood Risk Analysis Tools
Potential Sump Conditions and Overland Relief Flow Accumulation
Background
The original Potential Sump Conditions layer was created in early 2021. The creation of the layer was in response to the July 8, 2019, flooding event where sump conditions were one of the major factors contributing to flooding occurrences. Sumps are depressions or bowls where there is insufficient drainage for the water to get out of the depression. This can even be the case when there is a stormwater inlet in the sump, but it is overwhelmed due to magnitude of the incoming flows. This can result in flooding of roads, yards, and structures. The original goal of this project was to create a polygon layer that can be used to flag Potential Sump Conditions for Land Development Services (LDS) Plan Reviewers. The scope expanded over the past year with the influence of Saurabh Raje, Ph.D. from Maintenance and Stormwater Management Division (MSMD). The 3D Analyst Extension was utilized to calculate the Volume and the 3D Surface Area of the sump.
The Overland Relief Flow Accumulation layer was created to visualize the natural overland runoff flow paths including paths into and out of sumps. Unlike the Flow Accumulation layer used for Watershed Delineation that has stormwater pipes and streams burned into the surface, the Overland Relief Flow Accumulation flow path is strictly based on the bare earth elevation. This provides a clear picture of where the water flows when there is no stormwater management in place, or the infrastructure is overwhelmed.
County staff can use the Flow Accumulation Overland Relied layer and Potential Sump Condition layer to identify infrastructure in sumps, assess the impact of potential flooding, and protect existing and future infrastructure.

Analysis
The Potential Sump Conditions layer is the result of analysis performed on the 2018 Light Detection and Ranging (LiDAR) derived, Bare Earth Digital Elevation Model (DEM) and LAS Dataset. The first step in the analysis was to run the Fill Tool on the Bare Earth DEM. The next step was to run the Cut Fill Tool using the Bare Earth DEM (before raster surface) and Bare Earth Fill DEM (after raster surface). The output of the Cut Fill tool was a difference raster identifying all the depressions in the county that were filled by the Fill Tool. Any area that was less than 50sqft was removed. This was an effort to removed areas that were small imperfections in the DEM and not actual depressions. The raster was then converted to a polygon. The final layer only includes Potential Sump Conditions that intersect with Stormwater Inlets, Stormwater Manholes, Roads and Streams that intersect Roads.
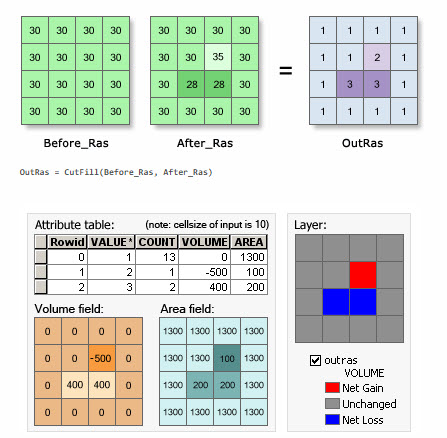
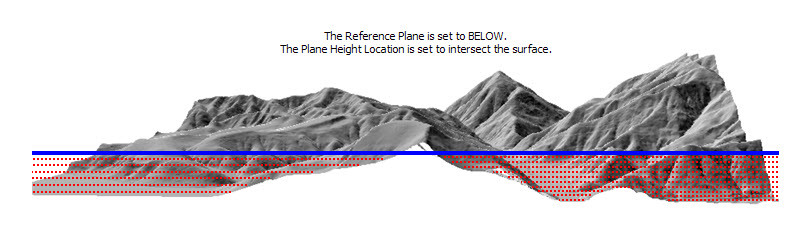
The Maximum Elevation and Minimum Elevation fields were generated by running the Zonal Statistics tool. The input raster was the 2018 Bare Earth DEM. The depth was determined by subtracting the minimum elevation from the maximum elevation. The Overland Relief Drainage Area is generated by running Zonal Statistics Tool. The source of the drainage area value is the 2018 Flow Accumulation Overland Relief (acres). The Surface Area and the Volume are generating by running Polygon Volume Tool. The maximum elevation of the sump was used as the reference plane parameter and the volume was calculated between the plane and the underside of the surface.
The Overland Relief Flow Accumulation layer is the result of analysis performed on the 2018 Light Detection and Ranging (LiDAR) derived, Bare Earth Digital Elevation Model (DEM). The first step in this process is running the Fill Tool . The fill tool removes any sinks in the DEM. These are cells with an undefined drainage direction. The next step in the process is running the Flow Direction Tool . The input of this tool is the Bare Earth DEM. Like mentioned above, we do not burn pipes or streams into the DEM. This tool creates a raster with cell values representing the flow direction from each cell to its downslope neighbor. The next step is to run the Flow Accumulation Tool using the Direction raster as the input. This will give us a new raster with the cell values representing the total number of cells that flow into each cell in the raster. We then convert these values into acres using the cell size and the count. This results in the drainage area calculation for each cell.
Use Cases
The following are the uses cases for the Potential Sump Conditions layer.
- Tool to assess existing site conditions when responding to service requests for structural, yard and road flooding.
- Tool to assess existing site conditions and potential impact of localized change in topography during redevelopment on adjacent properties if in sumps.
- Tool to assess potential impact of overwhelmed stormwater inlets in sumps on adjacent structures due to ponding of stormwater runoff.
- In concert with other spatial and field information, tool to prioritize sump conditions where structures may potentially be impacted based on depth of ponding, overland drainage area, and elevation of ground-level openings in structure.
- Tool to determine topographic features of the sump area including inflows, outflow, and extents.
- Ensure that proposed elevations of entry points into redeveloped structures (ie. areaways, walk-in basements, window wells) are adequately protected or situated away from the sumps if part of the redeveloped property is in a sump.
Real World Scenarios
This sump is located at a street intersection with overland inflows from multiple directions. Sump discharges to the north – north-west. The following video shows the water rushing into this sump condition. This sump is about 2-foot deep at its deepest point.
The sump filled up during the intense rainfall event on July 8, 2019. The video displays the sump filled with water. The video was captured from the south side of the road intersection looking north. Overland inflows are seen coming into the sump from multiple directions.
This sump extends through the backyards of multiple houses with overland inflows from the east and south. Sump discharges to the west from the backyard to the road. This sump is about 2.25-foot deep at its deepest point. The following photo shows the water surface elevation in the sump when infrastructure was overwhelmed.
The sump filled up during the intense rainfall event on July 8, 2019. This photo was captured looking north-east from the house at the southern extent of the sump. The observed water surface in the yard corelates well with the analyzed extents depicted in the GIS.
This is a road sump with overland inflows coming down from both sides of the street and the yards between the houses to the south. The sump discharges between the two houses to the north. The sump is about 2.3-foot deep at its deepest point in the road. The following video shows the flows in and out of the sump.
This video was captured looking north and pans across the extent of the sump from west to east. Runoff is seen flowing into the sump from between the yards as well as coming down the road to the east. As the video pans, the flow out of the sump is seen between the two houses on the other side of the road. Overland relief paths both in and out of the sump as well as the extents of the sump correlate well with the GIS analysis.
This is a sump in a stream valley with a drainage area of about 67 acres. The primary inflow into the sump is from the upstream flows discharging into the stream. The sump is over 10-foot deep at its deepest point where the stream enters the pipe system. The following photo illustrates a sump filled with water when infrastructure is overwhelmed.
This photo was taken looking north-west towards the sump. The incoming stream can be seen to the top right of the photo as it continues to bring runoff into the sump. Sump extents and overland relief paths corelate well with the GIS analysis.
Next Steps
· DPWES Stormwater plans to do further flood risk analysis using the Potential Sump Conditions layer to identify buildings that intersect with Potential Sumps.
· There is also interest in using the layer to identify sumps that define dry and wet ponds. This data would come from the raw data before we removed over Potential Sumps that did meet the requirements for flood risk.
· Potential Sump Conditions and Flow Accumulation Overland Relief will be updated when we receive new LiDAR in 2023.
· Potential Sump Conditions and Flow Accumulation Overland Relief publicly available in 2023


