
Spatial Analysis of School Climate
Introduction
New Jersey State Logo Flag (left), Location of New Jersey State (right, QGIS)
Students learn a lot from interacting with other students at school. Not only does the school's environment impact student growth, but students are also impacted by outside factors such as peer networking and their backgrounds. As a college student who values school environments, I expect this project will allow me to analyze the impact of outside factors on student behavior. Exploring student behavior is also important because the formation of the norm in school also impacts their academic achievement.
The dataset “Changing Climates of Conflict: A Social Network Experiment in 56 Schools” is a large-scale social network data drawn from the Inter-university Consortium for Political and Social Research (ICPSR). According to the theories of human behavior, individuals attend to the behavior of others in the same group to understand the social norms and adjust their behavior accordingly. This experiment conducted an anti-conflict intervention on 56 schools in New Jersey to test whether the human behavior theory indeed took place in the schools.
Significance
The significance of this project is that it aims to find the correlation between students' behavior and spatial analysis of their backgrounds. Understanding the theories of human behavior through spatial analysis helps individuals understand why and how they attend to the behavior of others and adjust their norms. Furthermore, this analysis will help people understand the impact of background on one's behavior, such as community characteristics, degree of urbanization, and geographical location. I hope this analysis further results in the development of school environments.
Data Critique
Timeline of the Experiment
Timeline of the Experiment (Figma)
First, ICPSR did a pre-research by measuring social networks in 56 New Jersey middle schools and then conducted the first wave survey to collect the demographic information of students. After the survey, they randomly selected 20~32 students to participate in the anti-conflict program. The schools that did not participate in the anti-conflict program are considered as a control group. Lastly, the experiment ends when ICPSR finishes the second-wave survey.
The method used for the data collection was a survey, which was conducted both before and after the anti-conflict intervention, from 2012 to 2013. Pre-survey mainly collected student's background information, they were mainly asked about who they spent time with, their norms, and demographic information. The post-survey allowed researchers to see the result of anti-conflict intervention. This dataset includes 482 variables for 24,471 cases.
Data Critique
By analyzing the dataset deeply, I was able to understand the possibilities, limits, and values of the datasets. Statistical analysis has limitations in this dataset, such as missing values and insufficient information. First, due to the statistical limitation, a non-integer variable did not contain a label. Also, there were a lot of variables that were undocumented and labeled as undocumented code.
Analyzing this data set, I was able to find out that there are ontologies that tend to assume that conflict is a negative thing in school, and it also rationalizes the intervention of third parties in school during the experiment. However, I believe that this can be viewed as a biased perspective that does not respect the diverse characteristics of students. Furthermore, conflict not only results in negative behavior but also can be a motive for self-reflection and personal growth.
Click to see a full Data Critique
Annotated Biblography
By finding an annotated peer-reviewed article that is relevant to my research questions, I was able to evaluate the dataset critically from diverse perspectives.
Click to see a full Annotated Biblography
Place the Literature
As a result of experiments, ICPSR found that an anti-conflict movement reduces school conflict. Socially connected students especially significantly impacted each other in shaping behavior against conflict.
Specifically, ICPSR collected students' networking information using "a questionnaire" that, for example, asks questions like "In the last few weeks, I decided to spend time with these students at my school," This is my best friend (or, these are my two best friends) at this school" (ICPSR). The ICPSR codebook starts with the processing notes that show risk, variable differences, undocumented codes, and missing values confidentially. Even though this dataset shows the information of variables specifically, it had a flaw in a codebook that had missing values and undocumented codes.
Overall, this research emphasizes the peer influence on other student's behavior, specifically in shaping the behavior related to their interactions with other students. I believe that the geographic location of a school significantly impacts student's behavior. For example, students attending school which is located in suburb area will have a high bond with other students. Also, schools will be more populated in urbanized areas showing urbanized area students have more educational opportunities than students in suburban areas. Furthermore, the conflict pattern will differ from the region, that it will be different by the degree of urbanization.
However, this dataset focuses on providing demographic and sociological information which is not directly related to spatial information. This dataset indicates each school using numbers; its locations and spatial data are not specified. Also, it does not directly explain how individual behavior has formed behavioral norms depending on the region.
Research Question
Process of Diverging Research Questions (Figma)
Setting draft research questions allowed me to decide on a research question related to core concepts and variables. By thinking and comparing research questions, I could choose a research question that would be most effective when answering through map visualization and simultaneously deliver the core concept of the data.
What is the correlation between factors that may affect students' environment?
This story map will focus on answering these research questions by visualizing datasets through diverse GIS tools.
Click to see a full Draft Research Questions
Data Visualizations
This map shows the location of New Jersey counties, which provides background information for an effective understanding of the maps that will be displayed. I did not use the base map to highlight only the New Jersey state. New Jersey has 21 counties. Which is a relatively small number than other countries.
Used tool: Arc GIS

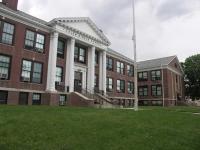
Bloomfield Middle School
Bloomfield Middle School. Click to expand.
Address: 60 Huck Rd, Bloomfield, NJ 07003
Salem Middle School
Salem Middle School. Click to expand.
Address: 51 New Market St, Salem, NJ 08079

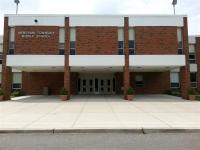
Mendham Township Middle School
Mendham Township Middle School. Click to expand.
Address: 16 Washington Valley Rd, Brookside, NJ 07926

Princeton Middle School
Princeton Middle School. Click to expand.
Address: 217 Walnut Ln #3484, Princeton, NJ 08540

Burlington Township Middle School
Burlington Township Middle School. Click to expand.
Address: 1600 Burlington Bypass, Burlington, NJ 08016
Mendham Twp Middle School
Mendham Twp Middle School. Click to expand.
Address: 16 Washington Valley Rd, Brookside, NJ 07926
Lincoln Park Middle School
Lincoln Park Middle School. Click to expand.
Address: 90 Ryerson Rd, Lincoln Park, NJ 07035

Memorial Middle School
Memorial Middle School. Click to expand.
Address: 808 Laura Herbert Dr, Point Pleasant, NJ 08742

Buena Regional Middle School
Buena Regional Middle School. Click to expand.
Address: 175 Weymouth Rd, Buena, NJ 08310

Lakewood Middle School
Lakewood Middle School. Click to expand.
Address: 755 Somerset Ave, Lakewood, NJ 08701
Bloomfield Middle School
Address : 60 Huck Rd, Bloomfield, NJ 07003
Bloomfield Middle School is located in Bloomfield, which is part of Essex County.
Image credit: https://bms.bloomfield.k12.nj.us/
Salem Middle School
Address : 51 New Market St, Salem, NJ 08079
Salem Middle School is in Salem County in New Jersey.
Image credit: https://www.salemnj.org/schools/salem_middle_school
Mendham Township Middle School
Address : 16 Washington Valley Rd, Brookside, NJ 07926
Mendham Township Middle School is located in Morris County.
Image credit: https://www.mendhamtwp.org/middle-schools
Princeton Middle School
Address : 217 Walnut Ln #3484, Princeton, NJ 08540
Princeton Middle School is located in Princeton, Mercer County.
Burlington Township Middle School
Address : 1600 Burlington Bypass, Burlington, NJ 08016
Burlington Township Middle School is located in Burlington County in New Jersey
Mendham Twp Middle School
Address : 16 Washington Valley Rd, Brookside, NJ 07926
Mendham Twp Middle School is located in Mendham in Morris County.
Image credit: https://www.mendhamtwp.org/
Lincoln Park Middle School
Address : 90 Ryerson Rd, Lincoln Park, NJ 07035
Lincoln Park Middle School is located in Morris County.
Memorial Middle School
Address : 808 Laura Herbert Dr, Point Pleasant, NJ 08742
Memorial Middle School is located in Ocean County.
Buena Regional Middle School
Address : 175 Weymouth Rd, Buena, NJ 08310
Buena Regional Middle School is located in Buena, Atlantic County.
Lakewood Middle School
Address : 755 Somerset Ave, Lakewood, NJ 08701
Lakewood Middle School is located in Lakewood, Ocean County.
01 / 02
1
School Point Location in New Jersey
This heat map shows in which region New Jersey's schools are concentrated. As can be seen from this map, schools are mainly concentrated in the northeastern area, which is close to New York. Also, the schools are concentrated in the area which is close to Philadelphia. Lastly, the schools are also concentrated in the Lakewood region.
Used tool: ArcGIS
2
Middle Schools Per County in New Jersey (chart 1)
Chart 1 shows middle schools per county in New Jersey in order, and it shows that Burgen, Essex, Middlesex, and Monmouth counties have the highest portion of middle schools per county. And this analysis of the dataset correlates with the map, that Burgen, Essex, Middlesex, and Monmouth counties are in the northeastern region of New Jersey, where schools are concentrated.
From this, we can speculate that the schools that are in the northeastern area will have a higher degree of urbanization and population density, which is related to student's networking with peers.
Used tool: Figma
01 / 04
1
Median Household Income in New Jersey
This map reveals the average household income by area. As can be seen from the legend, the median household income increases as the color gets darker.
Used tool: ArcGIS
2
The northeastern area's median income is higher than other areas
As can be seen from this map, the area that shows high median household income is mainly concentrated in the northeastern area. As can be inferred from this data, the northeastern area would be the most urbanized in New Jersey. The counties in the northeastern area are Passaic, Bergen, Essex, Morris, Hudson, and Union New Jersey's middle schools are concentrated (Chart 1).
3
Southern area's median household income is lower than other areas
The median household income in the southern area is much lower than in the northeastern area.
4
Relationship Between Population Density and Average Household Income in New Jersey (chart 2)
The Urbanized degree can be revealed by analyzing the correlation between the urbanized degree and population density. As can be seen in the Chart 2, Bergen, Passaic, and Union Counties showed the highest population density with a high average household income.
Therefore, I was able to speculate that there is a positive correlation between the average household income, population density, and concentration of New Jersey middle schools.
Students in the "Passaic, Bergen, Essex, Morris, and Hudson" counties will had more opportunities for networking with other students, from more diverse backgrounds of students, and more educational opportunities.
Used tool: Figma
01 / 01
1
Preserved Farmland
This map shows the preserved farmland in New Jersey. As we can see from the map, preserved farmlands are mainly concentrated in a particular county, such as Burlington, Hunterdon, Mercer, Salem, and Cumberland. This result contradicts the result of the urbanized degree. This means that the urbanized degree becomes low if there is a high portion of preserved farmland. Therefore, I was able to predict that there will be fewer middle schools where the less developed and the higher the proportion of preserved farmlands.
Used tool: ArcGIS
Image credit: https://discovercentralnj.com/farms-and-orchards/
Case Study
Bloomfield Middle School: Essex county
This 3D map depicts the area surrounding Bloomfield Middle School in Essex County. I created the map using 3D Mapper and designed the legend in Figma. As analyzed earlier, Essex County has a high concentration of schools, a relatively high median household income, and a high population density, suggesting a significant degree of urbanization. The map shows that the area around Bloomfield Middle School includes a substantial amount of green space, surrounded by roads, houses, and transportation infrastructure, with only a small portion of the natural environment.
Salem Middle School: Salem County (left), zoom out (right)
This map depicts the area surrounding Salem Middle School. As shown in Chart 2, Salem County has the lowest population density. Additionally, schools are not concentrated in Salem County, and the median household income is low. Overall, Salem County exhibits a low degree of urbanization. The area around Salem Middle School has a low building density, revealing a largely undeveloped landscape with a significant amount of open land.
Comparing the two maps, the first map shows a higher degree of urbanization not only the area around the school is developed, but also its development reaches in broad areas. However, the second map shows that From this visualization, I was able to conclude that the urbanized degree differs by county. Utilizing the point cloud layer enables to see the height of the feature at a glance.
Conclusion
In conclusion, I found a positive correlation among median household income, the degree of school population, and the level of urbanization. Furthermore, schools tended to cluster in counties with higher levels of urbanization. I believe this occurs because, in highly urbanized areas, the development of commercial districts, educational institutions, and residential neighborhoods attracts larger populations, thereby naturally leading to the construction of more schools.
Additionally, I observed that a higher proportion of preserved farmland correlates with fewer middle schools in those areas. In the case study, when comparing the areas around Bloomfield Middle School and Salem Middle School, I noticed that schools in more urbanized areas benefited from better infrastructure and taller buildings. Conversely, in less urbanized areas, the surrounding environment remained largely natural, and only the immediate vicinity of the school was developed.
Overall, this story analyzes and visualizes the background impact of the school on students' behavior in school. Understanding a theory of human behavior through analyzing and visualizing datasets can effectively lead to understanding diverse factors that impact one's behavior.
Reflection
I did a presentation before submitting my story map, and through this experience, I got meaningful feedback from my peers and Professor Horne. At that time, I had not finished the story map and planned to add more maps. Based on the feedback, the strengths of my story map were the map visualization format and the sufficient background of the dataset. However, I needed more visualizations that showed the correlations between school location and student behavior.
Thanks to the ESRI story map, ArcGIS, 3D Mapper.com, United States Census Bureau, and NJGIN Opendata, I was able to analyze and create a map that effectively reflects the dataset.
Peer comments
Shiui: "I really like the way you placed maps with other visualizations side by side, which complements text-based analysis and makes your story more comprehensive."
Reeshad: "I like the background information used to introduce the topic of school climate. The way QGIS is used for New Jersey and the literature implications are interesting."
What I learned & Future implication
Learning how to utilize ESRI story maps to deliver my insights to users was a good opportunity. Telling a story by visualizing a dataset with a map enabled me to think about the relationship between human-centric research and its spatial analysis.
Overall, this project gave me a meaningful experience in utilizing diverse GIS tools such as QGIS, ArcGIS, and 3D maps.
If I could expand this project more, I would create an app/website/networking tool to reduce school conflict behavior.


