Flooding In Venice
Areas of the Island At Threat Due to Climate Change

Flooding In Venice: A Serious Threat
The city of Venice, Italy is unique in structure, with the historical city residing over a series of 118 islands tied together through canals and bridges (1). Though the city has been around for over a thousand years, it now faces a significant threat: climate change.
As global temperatures have continued to rise, sea levels around the world have also been gradually rising as the result of permafrost melt and various other factors. As a result of this, Venice has been forced into a crisis that could eventually lead to the city going underwater. According to a recent report, if global temperatures are kept below a 2 degrees C rise above pre-industrial levels, Venice's sea level would rise by 32cm (13in) by 2100, the best case-scenario. In the worst-case scenario of a 4 degrees C increase in global temperatures, the city could experience a sea level rise of up to 180cm (5.9ft), which could cause significant flooding around the city.
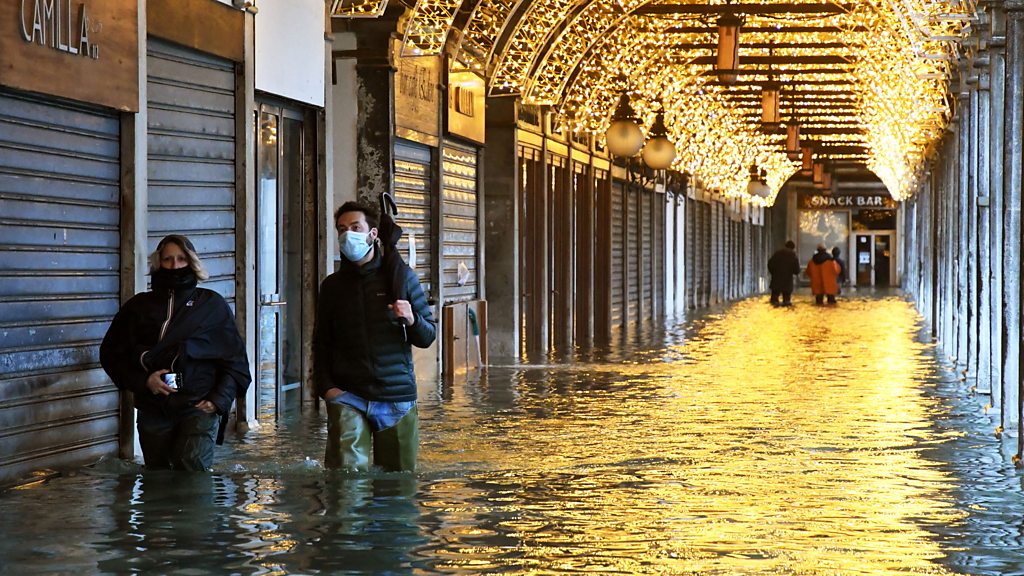
Flooding in St. Mark's Square in 2019
In 2019, the city was faced with the realities of that possibility as floods raged throughout the area, reaching heights of 187cm (6.1ft) at their peak. As a result, an estimated 80% of the city saw itself underwater, with over €1bn euros (£0.9bn/$1bn) worth of damage caused. (2) Since then, the city has implemmented measures to help maintain the water level in the Venetian lagoon. However, the threat of climate change continues to persist, putting many people and structures at risk.
Populations at Risk of Flooding
2023 Census Data Analysis

To understand the full extent of populations at risk of flooding in Venice due to sea level rise (SLR), it is first important to understand where those populations are centered. The image to the left is a visual representation of the population distribution within Venice based on block data collected in the 2023 census. Utilizing that data, it is possible to see the highest population centers around the island, represented by the areas in dark purple.
Further analysis of the same dataset was used to generate the population hot spot map below, depicting the areas with the highest and lowest population clusters on the island.
Map of Population in Venice, Hot Spot Analysis Utilizing 2023 Census Data
By performing an overlay based on the intersection of the population hotspots above, alongside the projected areas of cover due to sea level rises of .5M, 1M, 1.5M, and 2M, as shown in the maps above, this combined map was generated. The map depicts the areas and populations most at risk due to a SLR of these heights, due to both population density and elevation above sea level.
Populations At Risk Combined Map
Notably, this map only accounts for the population of residents on Venice's main island at risk of flooding, a relatively small proportion of the island's actual population at times. While about 254,014 people (according to 2021 census data) live in Venice proper, including mainland Venezia, only about 50,000 actually reside on the main island (3). A large portion of the island's population at any given point would largely consist of tourists or temporary residents. During peak season (summer months) it is estimated that there might be as many as 120,000 tourists on the island. Annually, this amounts to approximately 20 million people visiting the destination. (4)
Structures at Risk of Flooding
To get a better understanding of the risks presented by sea level rise and flooding in Venice, it is important to examine how flooding affects structures in the city. With the city of Venice's historical significance, many of its buildings were constructed at ground level, with minimal support measures put into place at the time. New construction is rare in the city, so many of the structures employ the original engineering methods utilized when the modern city was first constructed in the 1400s and 1500s, with even the most recent buildings dating back to the early 1900s. (5)
Flood Projections
A map of the structures was provided by LearnArcGIS, with data containing the heights, locations, and sizes of various structures throughout the city. Utilizing this data, a 3D map was able to be generated, extruding the structures to their appropiate heights. The same methodology was used to generate a visualization of the area in the city covered by a flood height of 2 meters.
Use the swipe feature to compare Venice's structures without flooding to the visualization of the island under a flood height of 2 meters.

Left: Venice without flood coverage. Right: Venice under a flood height of 2 meters, depicted in blue.
In order to better understand the impacts of flooding as the result of SLR on structures around the island, a series of analyses were performed using overlays like the ones performed in the previous section. The final map was then generated, depicting the structures on the island of Venice that would be impacted by SLR at heights of .5M, 1M, 1.5M, and 2M.
Structures at Risk in Venice Due to SLR
As with the floods in 2019, this map depicts that almost 80% of the island's structures would be under some degree of water at a SLR of 2M, which would likely lead to significant and expensive damage.
Conclusion
Based on the data presented, it is clear that a large majority of Venice's population and strucutres are at significant risk due to flooding provoked by climate change. Though the island is known for the "aqua alta" or high tide flooding that occurs frequently, the extent of damages caused by a larger flood far exceeds that.
MOSE System in the Venetian Lagoon
In recent years, the local government has attempted to address this issue, getting ahead of the impending issue by implementing the MOSE System. (2) This system utilizes a series of gates around the Venetian Lagoon, designed to reduce the flow of water into the lagoon, reducing the capacity for the lagoon to flood. Thus far, it has been relatively successful in holding off large-scale floods, though smaller floods still occur frequently. However, the MOSE system is not intended to be a permanent solution in the face of climate change, as employing the system costs around €323,000 (£280,000/$323,000). (2)
Long term, the city of Venice will need to find a more sustainable option to combat rising sea levels and reduce flooding in the city if it wants to survive. With its thriving tourism industry, local and national governments want the city to be successful in this endeavor, but it will require efforts on a global scale to do so.
Sources:
- Sparkes M. 2023. Top 10 Islands to Visit in the Venetian Lagoon. European Waterways. [accessed 2024 Dec 10]. https://www.europeanwaterways.com/blog/top-10-islands-venetian-lagoon/.
- Italy’s plan to save Venice from sinking. [accessed 2024 Nov 15]. https://www.bbc.com/future/article/20220927-italys-plan-to-save-venice-from-sinking.
- Venice, Italy Population 2024. [accessed 2024 Dec 10]. https://worldpopulationreview.com/cities/italy/venice.
- Jockims TL. 2024 Apr 28. With daily entrance fee “Disney-fication” of Venice, the world hits its overtourism tipping point. CNBC. [accessed 2024 Dec 10]. https://www.cnbc.com/2024/04/28/in-disney-fication-of-venice-world-hits-its-overtourism-tipping-point.html.
- How was Venice built? How to build a city on nothing... 2019 Jan 13. [accessed 2024 Dec 10]. https://allaboutvenice.com/how-was-venice-built/.


