
KC Region at risk of losing its most affordable housing
Increasing numbers of Low-Income Housing Tax Credit properties are eligible to leave the program. What happens next?
- Photograph of Waltower Lofts

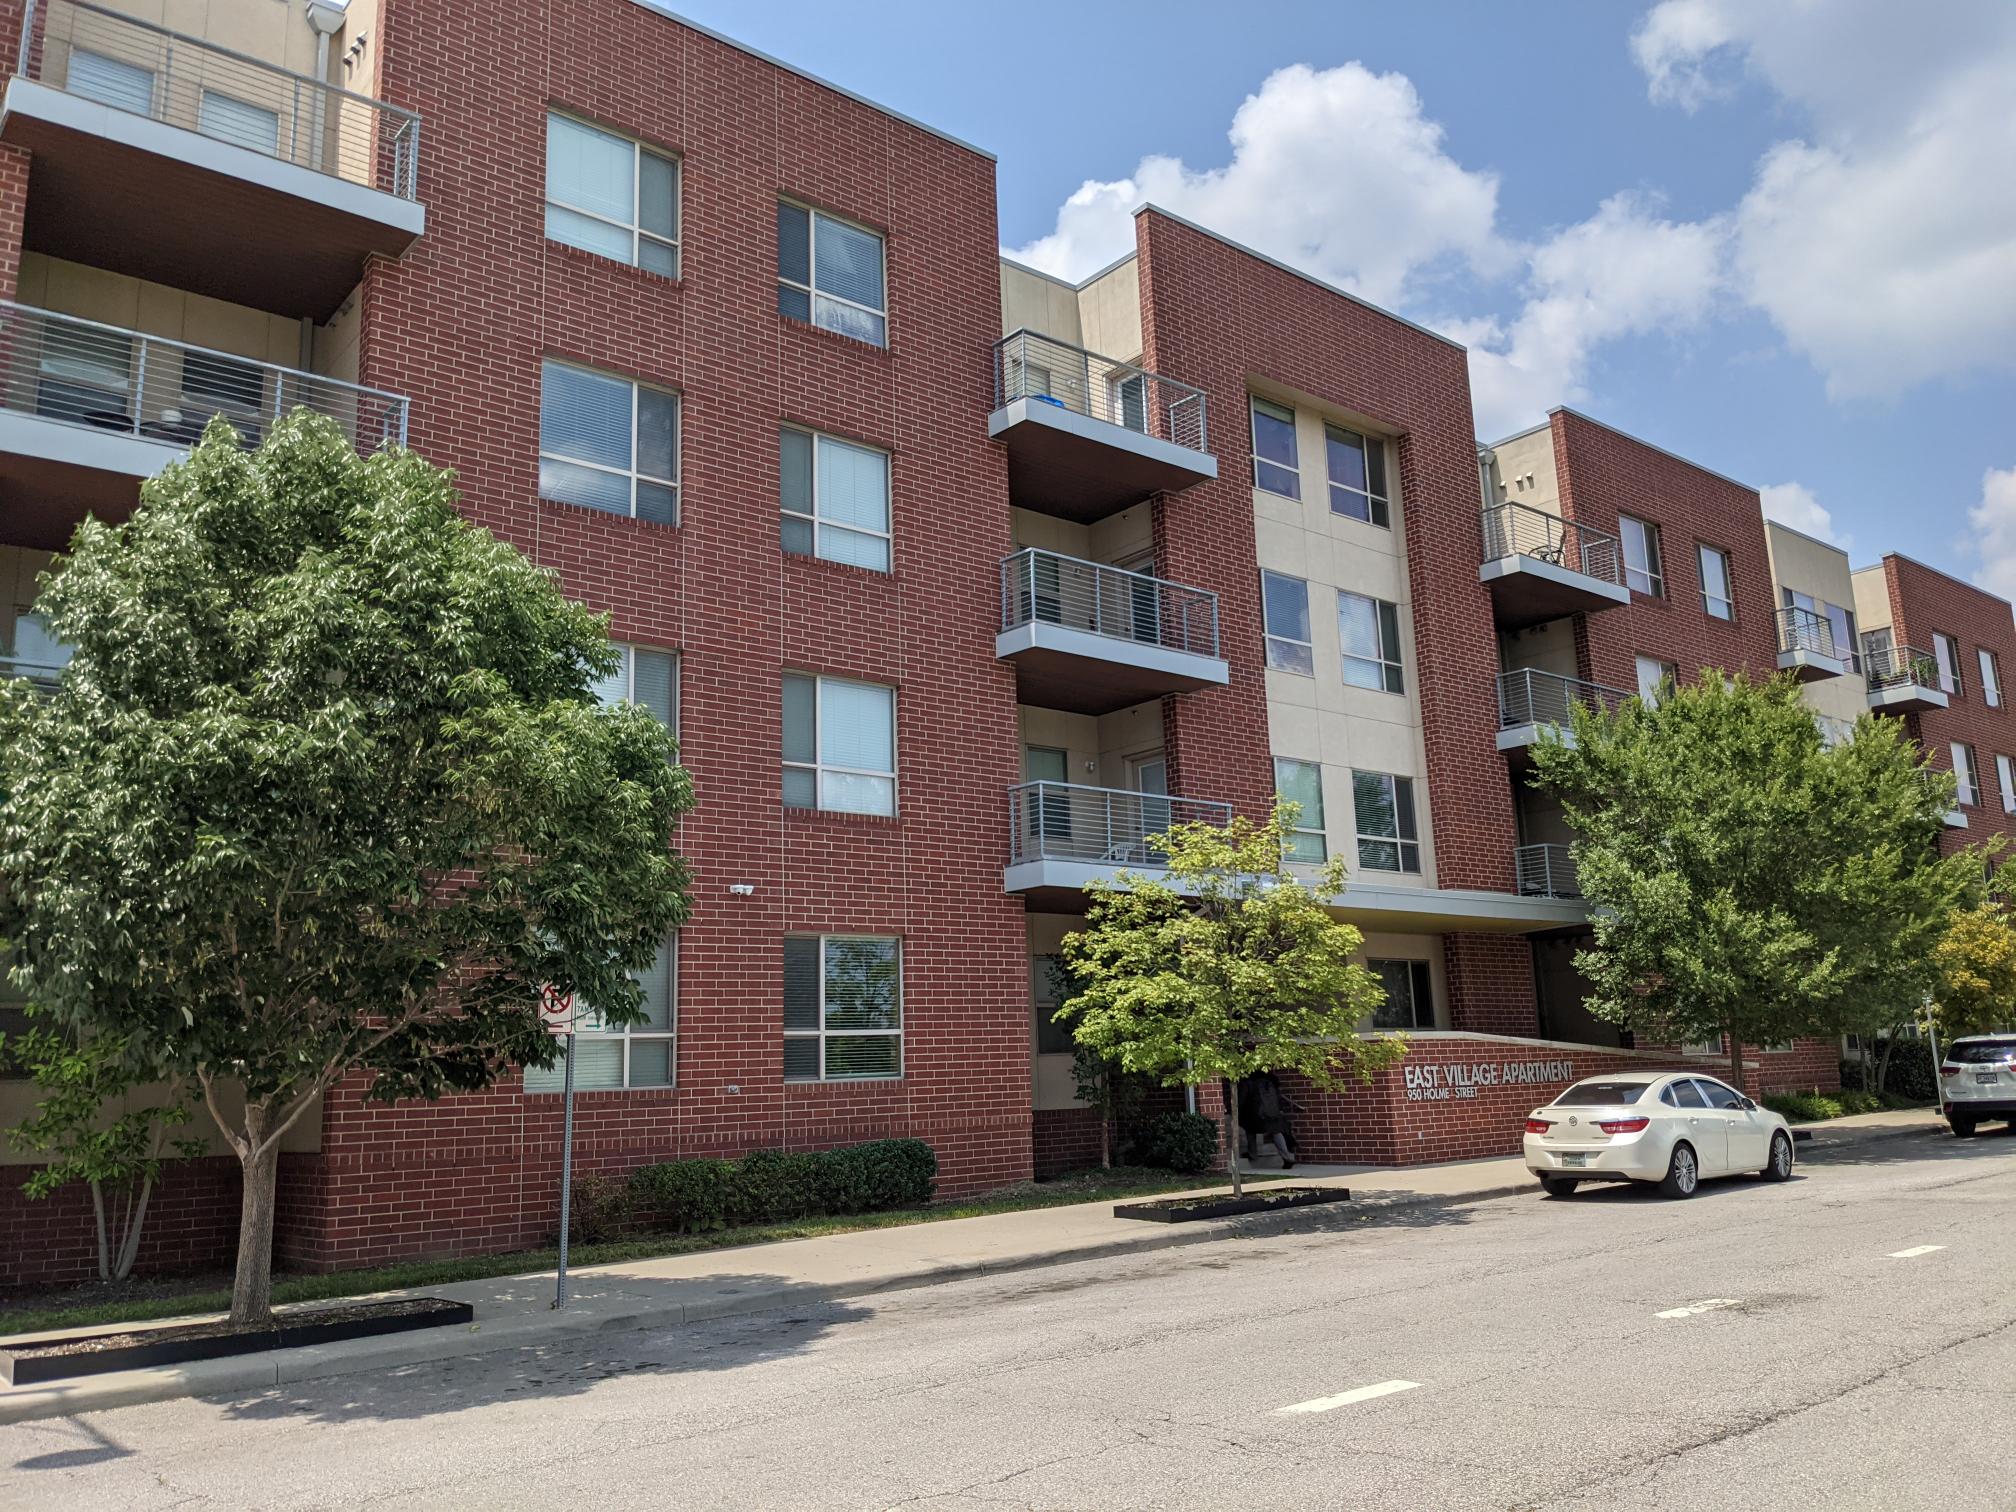
- A picture of the Professional Building Lofts at 1103 Grand Blvd, KCMO

A few examples of LIHTC properties throughout the Kansas City region
LIHTC is a huge contributor to the stock of affordable rental units in the Kansas City region and nationwide.
The Low-Income Housing Tax Credit program (LIHTC) has been the federal government’s primary policy tool for the development of affordable rental housing since the late 1980s. Nationally, the program has been responsible for 50,567 housing developments and 3.44 million housing units placed in service between 1987 and 2020 ( HUD ).
In the Kansas City region , the program has been responsible for supporting 536 developments and 27,779 units since 1987, and over 70% (20,538 units) of those remain under the affordability requirements today, according to the National Housing Preservation Database (NHPD) . For context, there are 284,385 renter-occupied housing units in the Kansas City region and an estimated 137,233 units rented by households with at or below $41,544 1 , which is 60% of the area median income (AMI), an approximation of the number of renters with incomes low enough to qualify for LIHTC in the region 2 . Assuming that nearly all LIHTC units are occupied, these figures mean that about 7% of total renters and 15% of renters with incomes 60% or less of the area median are living in a LIHTC unit.
About 15% of KC area renters with incomes at or below 60% AMI live in LIHTC units
There are 299 active LIHTC properties throughout the nine county MARC region, with a concentration in the Jackson County portion of Kansas City, Missouri, as shown in the map. Most properties are concentrated east of Troost Avenue, the historical dividing line between Black and white communities, in neighborhoods that already have high concentrations of poverty. (Click any dot on the map on the right to see more details about a specific property.)
New LIHTC unit production in the Kansas City region decreased by over 90% in the last decade.
New LIHTC production increased from the beginning of the program in 1987 through 2008, with annual production of units starting at 1,339 per year and rising to over 2,250. But the financial crisis of 2007-2008 that ushered in the Great Recession caused both investors and regulators to become much more cautious. Underwriting standards increased and the ability to finance construction diminished greatly. As a result, the program ground to a halt, both nationally and regionally. However, the downturn was especially rapid in the Kansas City region. Additionally, its rate of LIHTC housing production has been slow to rebound, averaging around 100 new units per year for the last decade. As a result, the Kansas City area saw a 90% reduction in the number of new LIHTC units produced in the 2010s compared to the rate just before the Great Recession due to both economic and policy issues.
Number of new LIHTC units in the Kansas City region compared to United States grouped by five-year period
LIHTC production in the Kansas City region dropped from 1,000 units per year in the mid-2000s to 100 units per year throughout the 2010s.
Minimal new units combined with ending affordability requirement periods put the Kansas City region at an inflection point.
The total number of active LIHTC units in the Kansas City region is facing a steep cliff. LIHTC properties built after 1990 account for 90% of active properties in the region. These are required to remain compliant with the U.S. Department of Housing and Urban Development's (HUD) affordability regulations for a full 30 years after they are built (with some exceptions 3 ). But this means that the bulk of the region’s LIHTC units began having the option to roll off the program and offer the units at market rates beginning in 2020. From 1990 through the mid-2000s the number of new LIHTC units created increased each year on average, which means the number of units potentially rolling off the program will increase each year until at least the mid-2030s. If the region’s current low rate of LIHTC housing production continues, the region risks losing 72% of its peak LIHTC housing stock, reaching levels not seen since the earliest days of the program.
In the map on the right, you can see the locations of LIHTC properties, colored by a five-year anticipated roll-off range. About one-quarter (5,162) of the Kansas City region’s 20,538 active LIHTC units are expected to reach the end of their affordability period within the next five-year period.
1 in 4 LIHTC units will become eligible to drop out of the program over the next five years.
The map at right animates the production of LIHTC properties over time and then illustrates where the impacts might be felt if they roll off the program at the end of their required 30-year affordability period. Of note is that the program began with properties mainly in the core of Kansas City, Missouri and Kansas City, Kansas, but then spread significantly to the suburbs. As a result, the potential reductions in affordable housing units from properties exiting the LIHTC program affects the entire Kansas City region.

What are the likely impacts of LIHTC properties reaching the end of their affordability periods?
1. A shift to wealthier renters due to the expiration of LIHTC income requirements
To assess what is happening locally when properties pass their roll-off date, we examined properties scheduled to roll off in 2020. We were able to match four properties, two in Johnson County, Kansas, and two in Jackson County, Missouri, with 2022 rents from the private real estate data company, CoStar TM . We found that these properties' asking rents remained about half that of their submarket average and were increasing one-half to one-quarter as fast as the average submarket rate. Based on this anecdotal evidence, it appears that it is likely true that most properties in the area that roll off LIHTC properties will remain affordable.
However, even if the properties remain affordable based on rent, those exiting LIHTC are no longer required to rent to households with incomes below 60% of the area median. Instead, the units may be rented to households with higher incomes (who do not need the subsidy), effectively transitioning from low-income housing to workforce housing. If this is the case, then even if rents remain low, there would be a loss of attainable units for households whose incomes are at or below LIHTC income thresholds.
2. Increasing rents for properties with for-profit owners located in favorable market locations
According to a report by Abt Associates commissioned by HUD, most older LIHTC properties are not at risk of becoming unaffordable. However, potential exceptions are those with for-profit owners in favorable market locations. Consider the map on the right to assess which properties might fall within these criteria.
(The map overlays LIHTC properties by roll-off date on a heat map of property values, with warm colors indicating higher values. Click on the icon with the bulleted list in the bottom left- hand corner of the map to expose the legend.)
To assess which LIHTC properties might be most likely to experience rent increases once they roll off, we used the map to identify high-wealth areas where markets are typically strong. As can be seen in the map, several LIHTC properties with roll-off dates in the next five years are in close proximity to such areas. These are concentrated around downtown and along Troost Avenue and the Paseo Boulevard in Kansas City, Missouri. Though historically properties east of Troost have seen little appreciation in value, this has changed over the last decade or so. Areas along Troost have begun to experience redevelopment pressures that may make LIHTC properties near the corridor more likely to experience significant rent increases after they reach their roll-off date.
We can refine this analysis further by examining which properties are owned by for-profit entities and whether they combine LIHTC with other subsidy programs to lower rents further than they can with LIHTC alone. This latter characteristic indicates a stronger commitment to providing financially accessible housing.
The buttons below allow viewers to see what happens when properties are filtered sequentially by which ones might roll off soonest, are profit-oriented and have no other subsidy being utilized besides LIHTC. (Click on the button a second time to remove the filters.)
The result of this filtering shows a narrow set of properties, with several large ones along the Troost/Paseo corridor, as well as one in Olathe, Kansas, that are also relatively near high-wealth areas. This combination of attributes makes them more likely to increase their rents to take advantage of appreciating market rates once they roll off LIHTC. If they do, this would have a high impact on the stock of lower-cost rental units due to their size and how quickly such a conversion might occur. As a result, it makes sense to target these properties for preservation efforts.
Limitations
The following are known limitations to this report:
- Other types of risks to LIHTC stock: There are other risks to subsidized housing besides the risk of exiting a program when requirements expire that were not considered here, but that can affect all types of affordable housing (not just LIHTC). According to research by Abt Associates as well as Freddie Mac , the largest risk comes from depreciation since older properties are likely to need substantial reinvestment to remain habitable and financially viable. Also, properties that need ongoing federal support to lower operating expenses are subject to appropriations risk. If appropriations don't keep pace with costs, some developments may fail and take their units completely off the market.
- Significant data limitations: The underlying HUD data has certain limitations, as documented by the National Low Income Housing Coalition and the Public and Affordable Housing Research Corporation (NLIHC/PAHRC). For example:
- The information in the database is not updated annually. In particular, ownership status is set initially when the property is occupied and may not be updated to reflect changes from non-profit to for-profit. As a result, risk of individual properties becoming market rate may be underestimated.
- It is unclear which properties may have exited the LIHTC program after 15 years as allowed using the Qualified Contract (QC) process.
- The 30-year roll-off date may be an estimate, especially for older properties.
- HUD’s database has a lag of two-three years from the in-service date to the availability of the information in the data set. The number of new units added in recent years may be underestimated as a result.
- There is no data on tenant mix, which can change significantly once the compliance period ends.
- Proximity to opportunity: This report focuses on the quantity of LIHTC units. An equally important consideration is the location of government subsidized housing and whether it is concentrating poverty in a few locations or opening up opportunity for historically disadvantaged populations to live throughout the region in mixed-income neighborhoods. Disadvantaged children who grow up in mixed-income neighborhoods and are able to establish cross-class friendships have been shown to have better life outcomes.
- Impact on communities: This report does not consider the effect of LIHTC properties on the surrounding community, though most research suggests LIHTC units are a net positive, even in higher income areas.
Next Steps
Originally signed into law by former President Ronald Reagan in 1986, the age of the LIHTC program means the bulk of the region's LIHTC properties are now old enough to begin rolling off the program. This will occur in ever greater numbers over the next several years unless there are significant efforts to preserve them. As a result, the region faces a potential LIHTC cliff that must be addressed if the region is to maintain, let alone improve, its stock of affordable housing. Unfortunately, the cliff is even steeper in the Kansas City region than nationally due to lack of LIHTC production since 2008. There are no easy solutions. However, combining suggestions from previous research 4 , the following next steps might help the region successfully organize to more effectively address this problem:
- Improve the database of LIHTC properties to address some of the limitations cited above. Better data can help further refine the challenges the region is facing and improve strategies the region may use to increase or preserve LIHTC housing. Actions to improve data might include:
- Upgrade the LIHTC data management and technologies to improve the ease of both data capture and reporting
- Encourage a culture of transparency among both property owners and Housing Finance Agencies (HFAs), with property-level data sharing as a key element
- Strengthen the ability of HFAs to enforce LIHTC provisions in order to obtain annual updates to property-level data
- Prioritize properties for preservation. This would extend the findings above to additionally include financial considerations, such as the cost of repairs needed to maintain habitability, as well as how well properties align with other key housing objectives, such as affirmatively furthering fair housing and increasing equitable access to opportunity.
- Organize and convene preservation stakeholder groups regionally. These groups can play a variety of roles, including hosting the property database; coordinating between owners, governments and non-profits to increase preservation efforts and advocate for strengthened policies; and assist with capacity-building efforts so that non-profits and tenants can become more effective preservation proponents.
- Begin to explore policy intervention strategies to preserve and curb the loss of LIHTC units. Of current note is the $50 million bond campaign in Kansas City, Missouri, to further capitalize the city's housing trust fund. If successful, this strategy could produce an additional 2,500 affordable units over 5 years. This is about half the number of units scheduled to roll off LIHTC during this period and could significantly reduce any loss of affordability that results.
Background: LIHTC Basics
For readers without a background knowledge of the LIHTC program, some additional information on the requirements mentioned in this data story can be found below. For a more detailed background on the program see, the Urban Institute's 2018 research report .
How LIHTC Works: Rent and Income Restrictions
There are three options for developers to meet LIHTC affordability requirement:
- 20-50 Test: At least 20% of the units must be occupied by individuals with income of 50% or less of AMI
- 40-60 Test: At least 40% of the units must be occupied by individuals with income of 60% or less of AMI
- Income Averaging Test: At least 40% of the units must be occupied by tenants with an average income of no greater than 60% of AMI, and no individual tenant has an income exceeding 80% of AMI
In addition to the income test, a qualified low-income housing project must also meet the “gross rents test” by ensuring rents (adjusted for bedroom size) do not exceed 30% of the 50% or 60% of AMI, depending on which income test option the project elected.
Developers were initially required to maintain these affordability provisions for 15 years. In 1990, the requirement was extended to 30 years for new LIHTC properties. However, developers were also granted the ability to exercise an option after 15 years to leave the LIHTC program by following a QC process.
How LIHTC Works: Financing and Construction
There are two main types of LIHTCs available to developers: 9% and 4%. The 9% credit is generally reserved for new construction and is intended to deliver up to a 70% subsidy. The 4% credit delivers up to a 30% subsidy and is typically used for rehabilitation of existing buildings and new construction utilizing federally tax-exempt bonds.
Both types of tax credits are intended to incentivize the development of affordable housing that otherwise may not be financially feasible or attractive to developers relative to alternative investments.
LIHTC tax credits are awarded to state HFAs by the federal government based on population. Developers propose projects to the HFAs, which then award credits based on criteria they develop. Developers sell those credits to investors, thereby providing a significant portion of the financing needed to build the project. This subsidy then allows the developer to charge lower rents to recoup the costs of the development than if the property had to be financed entirely with private money.
If a property is found to be in non-compliance in the first 15 years, the IRS can take back the tax credits. After that, state HFAs have limited ability to enforce compliance. Some states have begun to require developers to waive their right to the QC option as part of their original agreement with the HFA to obtain the tax credits.
Footnotes
- Data from United States Census Bureau 2020 American Community Survey 5-Year Estimates Table B25118 TENURE BY HOUSEHOLD INCOME IN THE PAST 12 MONTHS
- U.S. Department of Housing and Urban Development: HUD's regulations require the use of "area median income" or AMI to determine which households are low-income, where "area" refers to the metropolitan area as officially defined by the Office of Management and Budget. Generally, the cutoffs for low, very low and extremely low-income households are 80%, 50% and 30% of AMI, respectively.
- Exception to HUD's affordability regulations: Owners can opt out of the program after 15 years through a qualified contract process, though some may have waived that right to obtain tax credits in the first place. NHPD data does not include data on properties that exit the program early. These calculations use the 30-year LIHTC end date to estimate when properties might roll off the program.
- Previous research includes: National Low Income Housing Coalition and the Public and Affordable Housing Research Corporation (NLIHC/PAHRC) and 2019 Journal of Affordable Housing & Community Development Law article Strategies and Tools for Preserving Low Income Housing Tax Credit Properties by Lauren Loney and Heather Way.
- Numbers and statistics included in this text are based off of a point-in-time analysis in October 2022. Actual values after this date may be updated and different from the text included in this data story. The maps included in this data story will be updated with new NHPD data in February and September of each year. For updated numbers and statistics, or to explore the data on your own, please visit the Housing Data Hub.
Microsoft Forms