Quickly Diagnosing GLM Noise
Most false GLM flashes occur in common locations at predictable times, this knowledge reduces uncertainty when applying these data.
Understanding Geostationary Lightning Mapper (GLM) performance variability is key to confidently applying these data.
Plotting GLM flashes that lack corresponding ground-based lightning observations helps highlight artifacts and illustrate improvement.
Fig. 1. Density of GOES-East GLM flashes during the first year of operations which lack corresponding ground-based lightning observations within 200 ms and 50 km (panel a) and within 10 min and 50 km (panel b). Panel (a) closely resembles the true GLM climatology, indicating that the GLM observes many legitimate lightning flashes missed by the ground-based networks (reverse is also true). Broadening the temporal matching criteria to 10 min helps isolate genuinely false GLM flashes.
GLM Performance Improvement
Continuing improvements result from fine tuning the GLMs through onboard adjustments and software modifications. Updates seek to remove or reduce artifacts related to Sun glint, solar intrusion, subarray boundary inconsistencies, and/or platform stability disturbances.
Two Updates Proved Most Impactful
- A second-level threshold filter was first implemented on 2/27/19, and fully applied on 4/20/19 to help mitigate the “Bahamas Bar” artifacts.
- A blooming filter was implemented on 7/25/19 to help quench the rapid growth of Sun glint (mid/low latitudes) and solar intrusion (high latitudes) artifacts.
Fig. 2. Density of unmatched GOES-East GLM flashes (using 10 min and 50 km) with panels emphasizing time periods surrounding the second-level threshold and blooming filter implementations. Note the predominance of solar artifacts in the southern (northern) hemisphere during austral (boreal) summer (panels a and c).
Fig. 3. As in Fig. 2, but with longer early/late periods (panels a and d) to highlight the before/after performance.
Fig. 4. Density of false GLM flashes for 12/20/2017 - 02/27/2019 (with and without values < 0.01 flashes per square km per month visible)
Early GLM Observations
As the first instrument of its kind, the GLM reveals the immense technological challenges associated with detecting lightning from 22,000 miles above.
Initial observations provided the baseline evidence needed for improvement, motivating both minor adjustments and more impactful filter modifications.
Fig. 5. Density of false GLM flashes for 7/26/2019 - 12/31/2021 (with and without values < 0.01 flashes per square km per month visible)
Most Recent GLM Observations
Observe much cleaner distributions following second-level threshold and blooming filter implementations.
False events are still detected in common regions, but are much less pronounced with proper filters in place.
Early versus Most Recent
Contrasting before/after helps highlight the remaining (less pronounced) false event regions.
Remaining artifacts reveal the challenges of continuously detecting nearly all lightning over an enormous region (often with a sun-lit background).
Fig. 6. Density of false GLM flashes for 12/20/2017 - 02/27/2019 (left) versus 7/26/2019 - 12/31/2021 (right) with values < 0.01 flashes per square km per month invisible
Although false flashes can occur anywhere, they are infrequent and tend toward preferred locations.
Remaining artifacts might be considered analogous to radar ground clutter, with GLM noise typically being more subtle and predictable.
GOES-West Distributions
Knowledge of spatial and temporal variability of the GOES-East GLM artifacts directly translates to the GOES-West GLM, although the GOES-West GLM is more sensitive/noisy.
Fig. 7. Density of unmatched GOES-West GLM flashes (using 10 min and 50 km) with panels emphasizing time periods surrounding the second-level threshold and blooming filter implementations. Note that one half of the subarray is more sensitive than the other, and that its location changes twice a year during yaw flips.
Fig. 8. As in Fig. 7, but with panel (d) including the most recent two years of observations for completeness.
GLM Artifact World Tour
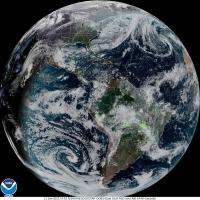
GOES-East Satellite Subpoint
Considering the satellite viewpoint and the Sun's location helps locate array relative data quality artifacts.

Sun Glint (Satellite Subpoint)
Glint occurs in the summer hemisphere when Sunlight reflects off calm water/marshland or man-made structures (e.g., solar farms).

Hot Pixels
Inherently underperforming pixels are intrinsic to the GLM CCD array.

Bar Artifacts
False flashes are detected along certain subarray boundaries when clouds persist around local noon.

Solar Intrusion
Numerous transient false GLM flashes occur during eclipse seasons (late-February to mid-April and late-August to mid-October).

GLM Sun Glint (Edges of Field of View)
One of the most common sources of false GLM flashes is Sun glint associated with sunrise and sunset over (relatively calm) sea water.
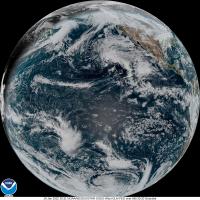
GOES-West Satellite Subpoint
Considering the satellite viewpoint and the Sun's location helps locate array relative data quality artifacts.
GOES-East Satellite Subpoint
Considering the satellite viewpoint and the Sun's location helps locate array relative data quality artifacts.
Sun Glint (Satellite Subpoint)
Glint occurs in the summer hemisphere when Sunlight reflects off calm water/marshland or man-made structures (e.g., solar farms).
Artifacts can spread beyond the glint source (blooming filter limits the growth of these features).
Very common occurrence over the Amazon River Basin.
Hot Pixels
Inherently underperforming pixels are intrinsic to the GLM CCD array.
Some hot pixels resolve themselves while others must be "air brushed" out using the second level threshold filter.
Background radiance and thresholds are higher during the day, disguising some of this noise, making the artifact most pronounced at night.
Bar Artifacts
False flashes are detected along certain subarray boundaries when clouds persist around local noon.
Apparent by their known locations and linear nature, distinguishable from nearby lightning by their anomalous characteristics (see above).
Greatly reduced following second level threshold filter, now must consider an “inverse” bar artifact under similar solar/cloud conditions.
Solar Intrusion
Numerous transient false GLM flashes occur during eclipse seasons (late-February to mid-April and late-August to mid-October).
Dramatic pre-blooming filter solar intrusion artifacts are much less pronounced following the blooming filter implementation.
ABI mechanically blocks the Sun during these periods (resulting in temporary regional ABI outages) while the GLM stares right at it!
GLM Sun Glint (Edges of Field of View)
One of the most common sources of false GLM flashes is Sun glint associated with sunrise and sunset over (relatively calm) sea water.
Sun glint artifacts are much less pronounced with the blooming filter in place (see final frames in video above).
GOES-West Satellite Subpoint
Considering the satellite viewpoint and the Sun's location helps locate array relative data quality artifacts.
Randomly Located False Flashes
1) Radiation Dots
- Short-lived, single-pixel false GLM returns which appear randomly in space and time
- Caused by high-energy particles incident on the GLM focal plane
- All single group flashes are removed to help mitigate this artifact (i.e., radiation dot filter)
2) Spacecraft Stability Disruptions
- Orbital maneuvers such as satellite alignment/repositioning can result in temporary GLM outages or false returns along almost all cloud edges (both conditions are very obvious)
- Messages about possible outages/spacecraft disruptions are shared by OSPO here: https://www.ospo.noaa.gov/Operations/messages.html
3) Rebound Events
- Abnormally bright, long-lasting flashes can cause “undershoot” in pixels aligned radially toward nadir - this generates false returns following the original flash until the background average recovers
- Most common at night and with the GOES-West GLM
- Artifacts often resemble real lightning flashes that struck outside cloud edge (see example imagery below)
4) Bolides/Satellites
- GLM detects any sudden brightness (e.g., exploding meteors or bolides)
- Bright space-based objects in the field of view (e.g., space rocks or other satellites)
- May show up as a streak or single pixel of false flashes (see example imagery below)
Clockwise from top left when viewed in full screen: (a) Plan view of satellite traversing the GLM field of view, (b) three panel gridded product depiction of a satellite streak (gridded products flash extent density, minimum flash area, and total optical energy over ABI channel 13), (c) gridded product view of a rebound event from the GOES-West GLM (flash extent density over ABI Channel 13), (d) detailed energy distribution associated with the rebound event, (e) plan view timeseries of the rebound event, (f) GOES-West GLM perspective of a bolide over Cuba which produced initial optical emissions as well as reflections off the vegetated surface, (g) as in (f) but from the GOES-East GLM. On mobile, the order from top to bottom is panel (a), (b), (g), (f), (e), (d), and (c).
Acronyms
- ABI - Advanced Baseline Imager
- CCD - Charge Coupled Device
- GLM - Geostationary Lightning Mapper
- GOES - Geostationary Operational Environmental Satellite
- OSPO - Office of Satellite and Product Operations


