Landsat 2
After launch in 1975, Landsat 2 began to collect remote sensing data. Outliving its one-year design, Landsat 2 achieved seven years of operation. With two Landsats in orbit, scientists gleaned additional views of the planet.
With this uninterrupted data, the record of the Earth's land surface could always be recorded, allowing for reliable imaging for scientists, policy makers, and land managers.
First Light Image
Landsat 2’s first light image captured Drayton Valley in Alberta, Canada on January 24, 1975. Located along Canadian Highway 22, also known as Cowboy Trail, the town’s original economy thrived on faming and logging. The discovery of the Pembina oil field in 1953 contributed to explosive growth in the sparsely populated area, with an increase from 75 individuals to 2,000.
The boxed pattern seen here comes from the infrastructure for the oil and gas industry. Roads and utility corridors interconnect allowing access to well sites.

LACIE
The Large Area Crop Inventory Experiment (LACIE) was run by an interagency team of federal partners comprising USDA, NASA, and National Oceanic & Atmospheric Administration (NOAA). LACIE’s primary objective was global crop monitoring, in particular wheat production. Using Landsat data, scientists could predict annual yields and year-to-year variability.
The LACIE program ended in 1979, just as another agricultural endeavor began. Project Agriculture and Resources Inventory Surveys Through Aerospace Remote Sensing (AgRISTARS) was a natural successor. Federal participants included USDA, NASA, United States Department of Commerce, United States Department of Interior, and United States Agency for International Development. AgRISTARS’ focus was beyond wheat, incorporating other crops like corn and soybeans. Within the USDA, the Foreign Agricultural Service used the data to improve global crop commodity forecasts. Both LACIE and AgRISTARS paved the way for modern digital satellite image processing.
Landsat Sees Substantial Growth in Beijing
Beijing has grown and changed remarkably since 1979, in its own distinct patterns. U.S. cities, for example, are often shaped like a circus tent, with a sharp peak of skyscrapers in the center, sloping off to mid-rise buildings and then low suburbs of single-family houses.
Beijing, by contrast, is bowl-shaped, with low historic buildings in its center, surrounded by many commercial skyscrapers and residential towers. Height restrictions have limited many buildings to 3 stories within 250 meter of the Forbidden City, 10 stories within the Second Ring Road, and unlimited stories beyond.
Beijing traditionally consisted of the square, walled Inner City and the rectangular, walled Outer City to its south. The walls no longer stand, but in their place the Second Ring Road now outlines the Inner City, and canals outline the Outer City. These and the outer Third Ring and Fourth Ring Roads are partly visible in the Landsat images.
The Capital Airport is the large runway complex northeast of the city. A new runway opened in 2007, and that expansion is evident in images from 2000 and 2021. In 2000, the Capital Airport handled 21.7 million passengers. In 2011, it handled over 77 million. In only 10 years, it moved from the 42nd busiest airport in the world to the second busiest.
People's daily activities now take place in separate parts of the city, resulting in increased traffic and congestion. An extensive subway line now operates in Beijing. By 2010, the subway network had 14 lines, 198 stations, and 336 kilometers of track.
The Chinese government has provided a bicycle renting system in Beijing to try to relieve traffic congestion. But car use has risen dramatically in the last decade, and city planners are planning around the automobile and building expressways.
Bellingshausen Sea, West Antarctica
Along the coast of West Antarctica’s Bellingshausen Sea, ice frequently retreats inland or is lost to the sea. Scientists have known this for years but lacked a full picture of the scale. Now a team of researchers has compiled a Landsat-based dataset and found that such losses have been going on for at least four decades along the vast majority of the coast.
The images above show an area near Eltanin Bay, where the majority of the grounding line is found at the ice’s seaward front. The top image was acquired by Landsat 2’s Multispectral Scanner on February 18, 1975; the second image was acquired by Landsat 8’s Operational Land Imager on March 2, 2015. Turn on the image comparison tool to see the scale of retreat. The loss is most pronounced along the Ferrigno Ice Stream, named for Jane Ferrigno, a U.S. Geological Survey scientist who used satellite data (including Landsat) to map Antarctica.
Using Landsat-based data, scientists have provided important context for understanding the causes of ice retreat throughout Antarctica. Changes have occurred for decades in the area, but the challenge is to find which key factors are responsible for ice loss and not simply correlated.
Explore the world through Landsat Two's sensors with the map below.
Huang He Delta, 1976
Honduran Shrimp Farms, 1976
Five Day Freeze, 1977
Aral Sea, 1977

Pune, 1976
Lake Hamoun, 1976
Huang He Delta, 1976
The Huang He River in China is a wanderer. Its lower reaches have changed course many times, moving the delta up and down the coast several hundred kilometers over the centuries.
The Huang He (Yellow) River is over 4,800 kilometers long. It’s the second longest river in China and the fifth longest in the world. It’s also the muddiest on Earth. On its long journey, it crosses a soft plateau covered with fine, wind-blown soil. The river carries away millions of tons of this delta-building material every year. The Huang He derives its yellow color from fine particles of mica, quartz, and feldspar.
The river shows up well in most of these Landsat images because of the high sediment load, which reflects light. The sediment is even visible in the water as the river flows into the sea.
Honduran Shrimp Farms, 1976
The Gulf of Fonseca is ideal for shrimp farming. Shrimp thrive in its warm temperatures, and extensive salt flats provide the space needed for the shrimp farms. The farms are actually holding ponds, which appear as rows of rectangles in these Landsat images. The ponds are stocked with either wild shrimp (shrimp fry) brought in from the gulf or shrimp raised in a hatchery.
Throughout the 1980s, the Honduran government tax incentives helped build the industry. This policy, along with water quality degradation, led to conflicts between the shrimp farmers and fishers. Initially, shrimp farms may have displaced some fishers. Regulation of the industry helped alleviate conflicts. Agreements controlled growth of the shrimp farm industry and established protected areas.
In the 1990s, expansion of the shrimp industry slowed, and measures were taken to make the industry more sustainable. Many of the remaining mangrove areas were declared wildlife refuges. These sites help to protect the wildlife, biodiversity, and water quality of the region.
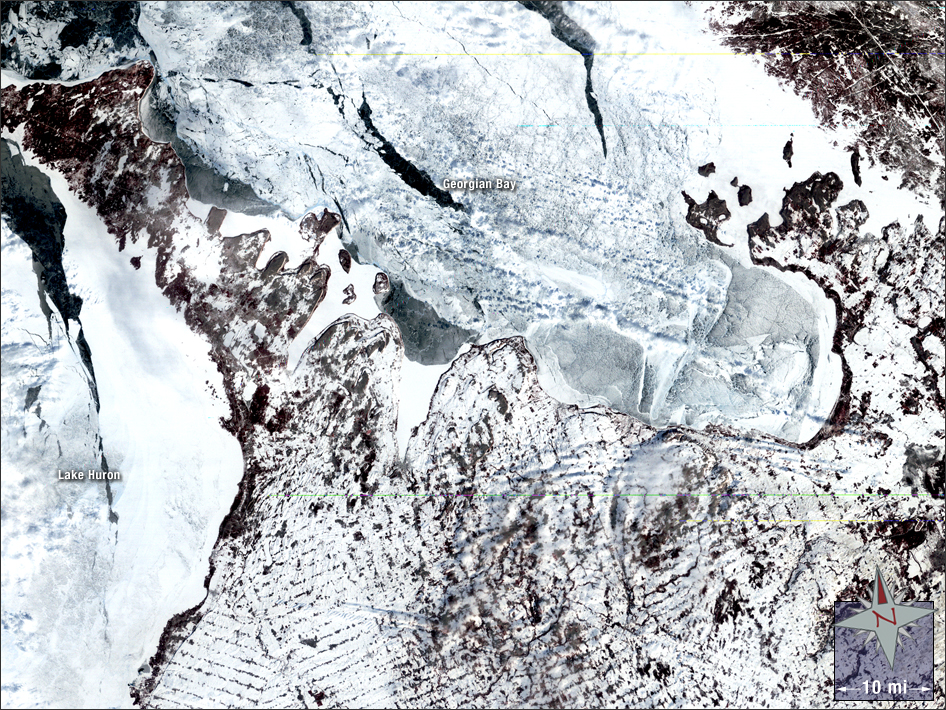
Five Day Freeze, 1977
On January 28, 1977 a five-day blizzard brought freezing temperatures, low-visibility, 60 miles per hour wind gusts, and snowdrifts as high as 30 feet to a region extending from southern Ontario to Buffalo, New York. In this Landsat 2 image taken on February 6, 1977, nearly everything is blanketed by snow including Lake Huron and the Georgian Bay, which were largely frozen over.
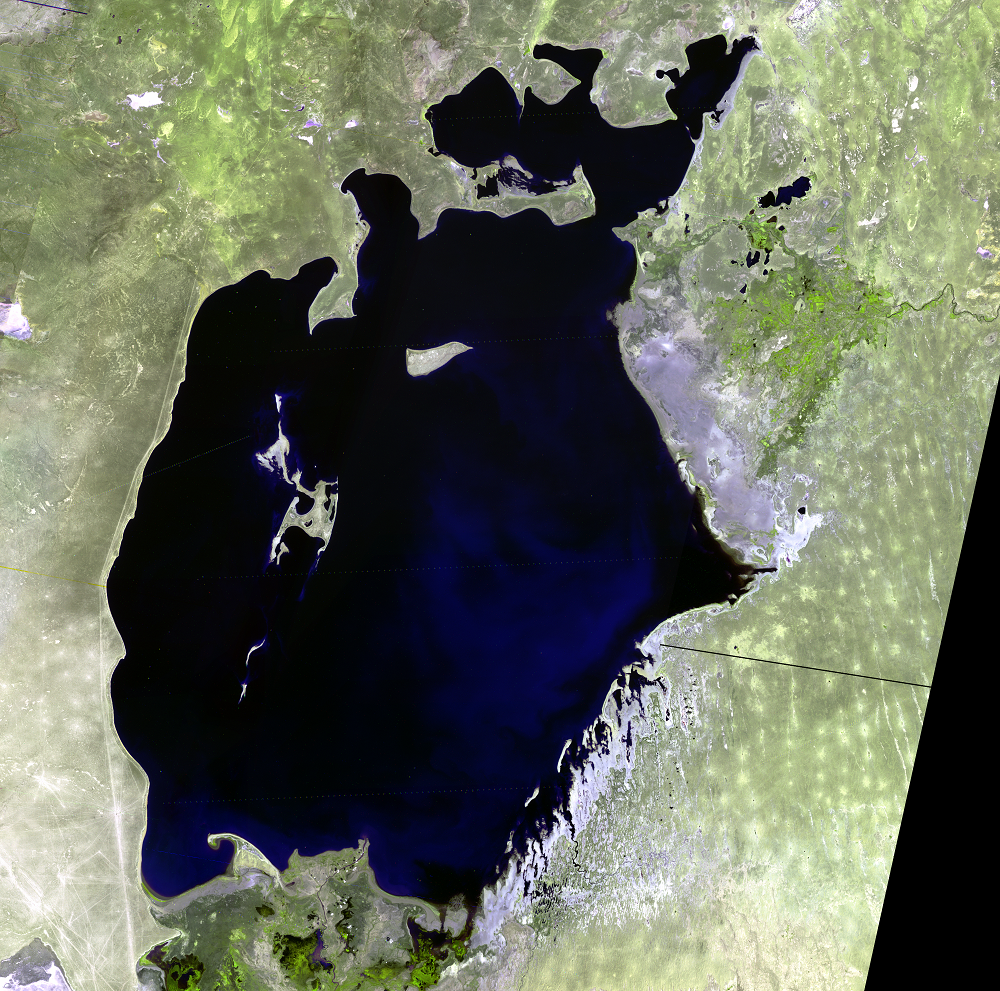
Aral Sea, 1977
The Aral Sea was once the fourth largest lake in the world. Situated in a desert region of Kazakhstan and Uzbekistan, two rivers, the Syr Darya and the Amu Darya, carried snowmelt and rainfall from distant mountains to where they pooled in the Aral Basin. The Aral Sea supported farming in the river deltas and a fishing industry up through the first half of the 20th century.
Then in the 1960s, the Soviet Union converted the local economies to cotton production and diverted the two rivers for irrigation. With no other major source of water, the Aral Sea has been evaporating and shrinking ever since. After 50 years, the lake's area is 25 percent of its original size and it holds just 10 percent of its original volume of water.
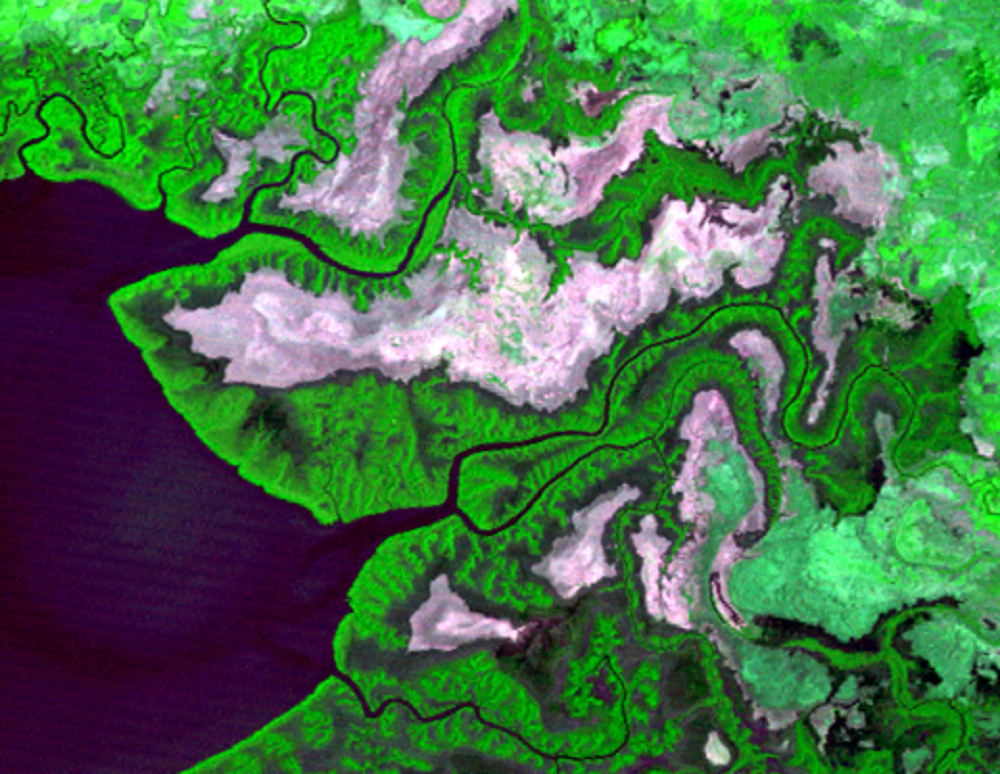
Pune, 1976
A fast-growing city in India is a study area for urban impervious surfaces and the urban heat island effect. Located in western India about 120 kilometers southeast of the coastal city Mumbai, Pune is known as an educational and industrial center. Its population has ballooned from 450,000 in 1950 to nearly 6 million in 2017 as rural residents migrate to the city for better employment opportunities. The education and industrial sectors, meanwhile, attract migrants from other countries.
False-color Landsat images show the steady expansion of the Pune metropolitan area. Forests cover higher elevation land, shown in bright green, mostly to the west. Dull colors are shrubland and grassland, which occupy the lower elevations. Urban land—the lavender and purple hues—has expanded over grasslands, barren, and agricultural land.
In a city as large as Pune, where the population is growing and those built-up surfaces are expanding so rapidly, the associated effects of streamflow changes and the urban heat island effect need to be measured and monitored.
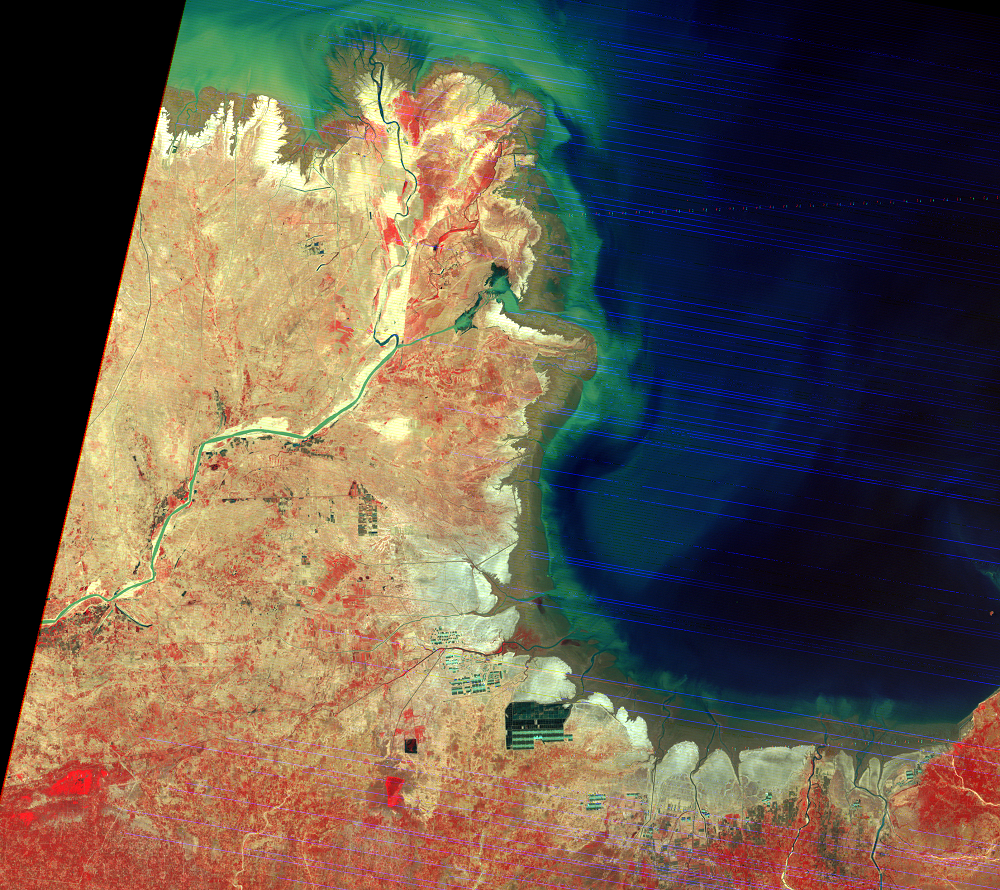
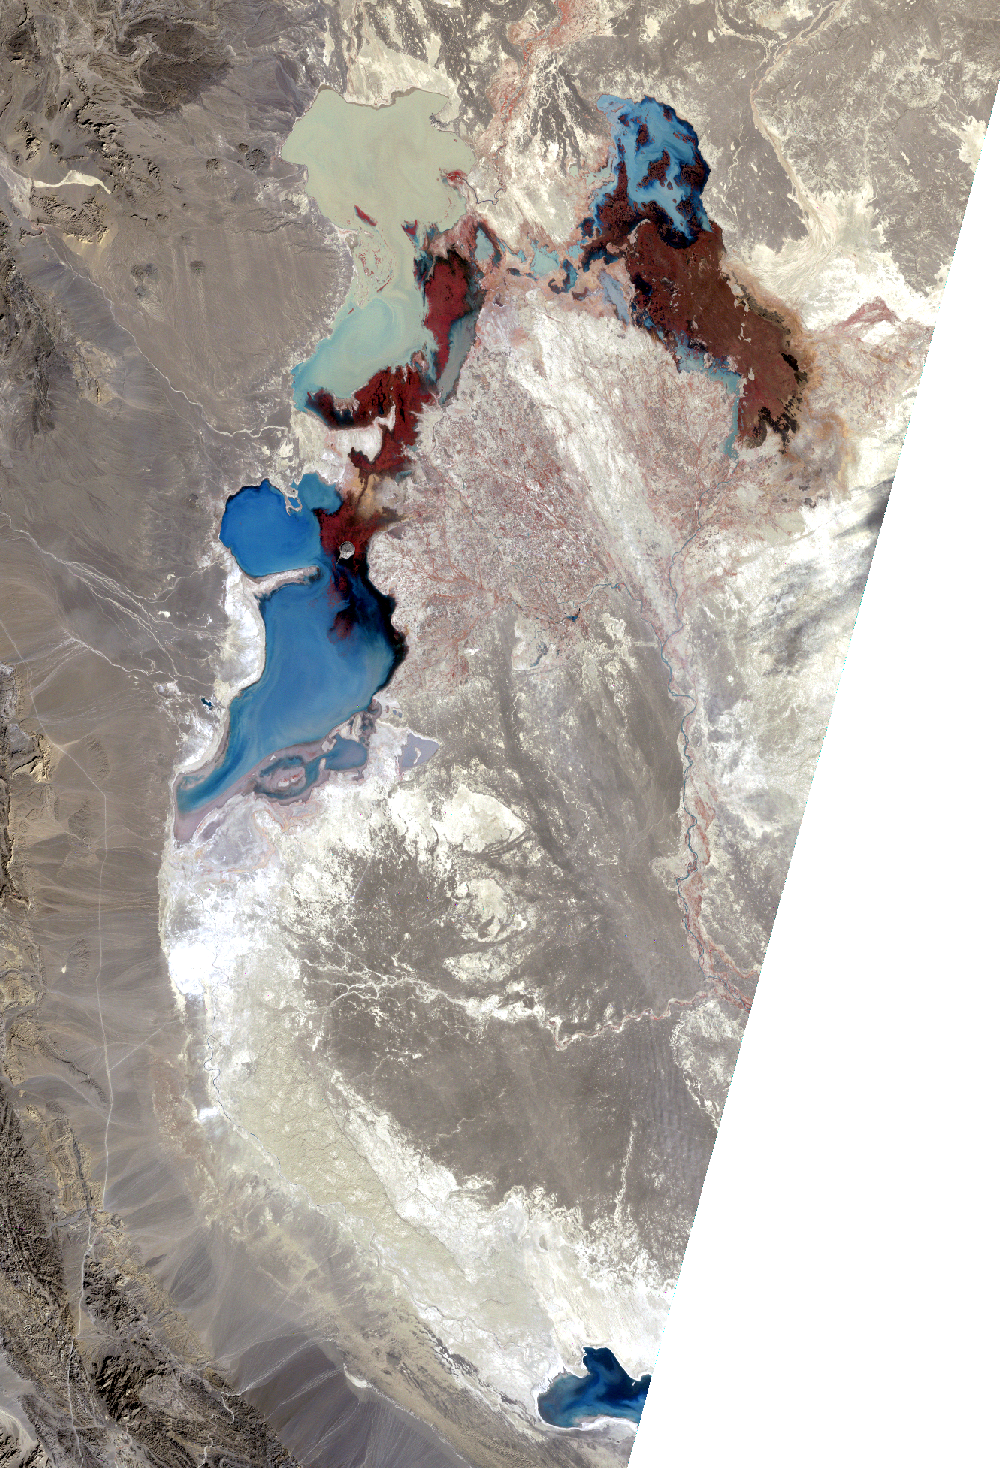
Lake Hamoun, 1976
The Sistan Basin lies on the Iran-Afghanistan border. Melted snow from the Hindu Kush Mountains of Afghanistan nourishes this dry basin. The Helmand River carries snowmelt across the Margo Desert and into the Sistan Basin, where water pools into Lake Hamoun. Sometimes, anyway. Lake Hamoun is seasonal, and water is generally only present during the spring melt season.
Surrounded by hundreds of kilometers of arid plains, the Sistan Basin is in one of the driest regions in the world, so the three shallow lakes that make up Hamoun naturally expand and contract in the wet to dry seasons. These lakes and wetlands once supported great plant and animal diversity. But drought and water diversion for irrigation has caused Lake Hamoun to nearly disappear, along with the local bird and fish populations.


