
Accounting For Carbon
How much carbon is stored in the University of Minnesota Cloquet Forestry Center?
Background
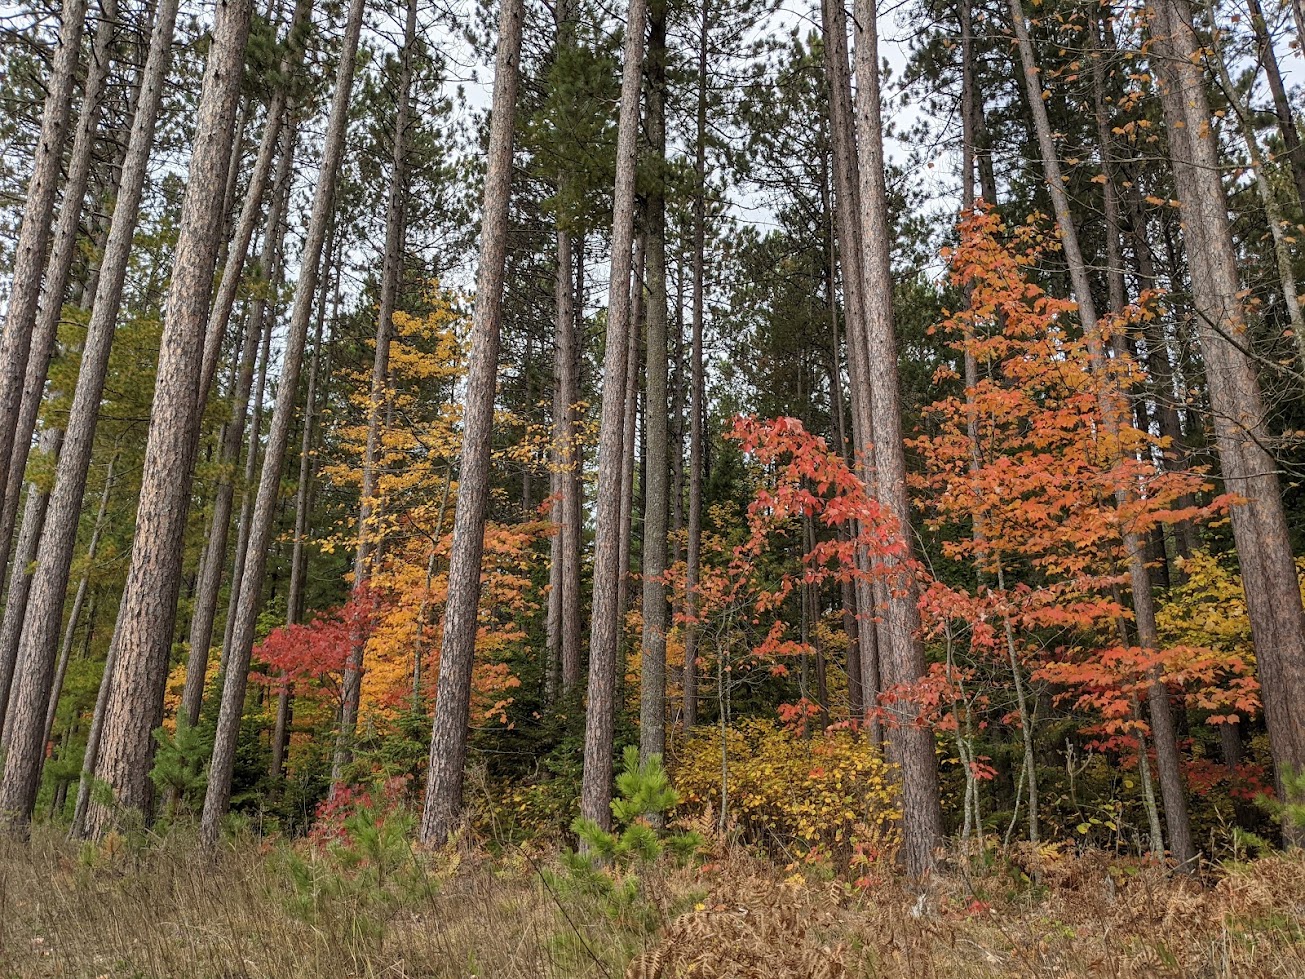
Fundamental to life on earth is the ‘carbon cycle’, a system where carbon in various chemical forms flows from land and water through the atmosphere and back. Forests play a very important role in this cycle by sequestering carbon from the atmosphere (Figure 1) and also releasing carbon through decay and disturbance (Figure 2).
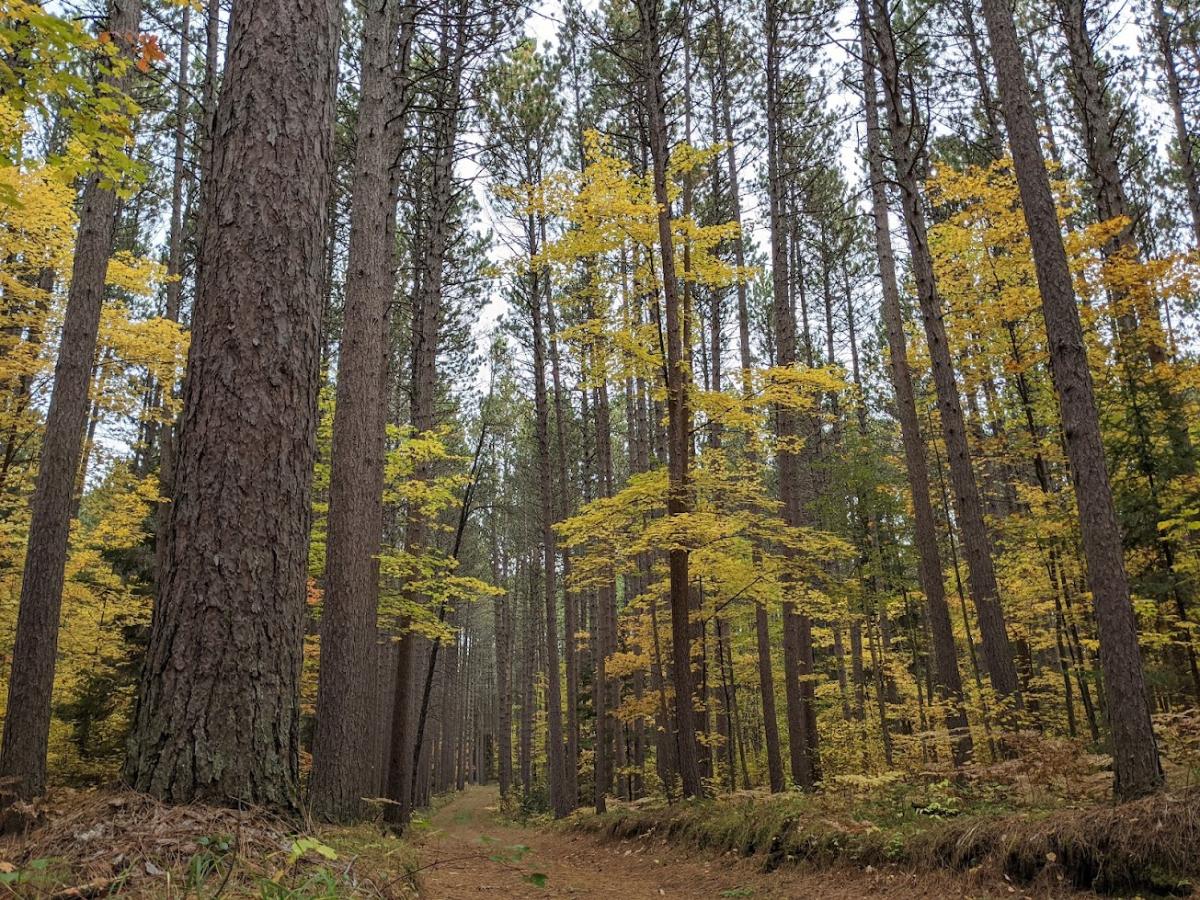
Figure 1: The mass of a living tree is roughly 50% carbon.
Forests are the largest terrestrial carbon sink on Earth . Managing forests to store carbon can be an effective way to offset atmospheric CO2 (carbon dioxide) emissions. With the realized importance of forests' abilities to sequester carbon from the atmosphere, forest carbon has been commoditized through the creation of forest carbon markets . Forest carbon markets allow for an alternative revenue stream, in addition to timber production, which can encourage forestland owners to manage their trees to promote carbon sequestration. However, to manage forests for carbon uptake and to enroll in forest carbon markets, landowners need to routinely measure (estimate) the amount of carbon in their forests with high precision. Repeatedly measuring the amount of carbon stored can be prohibitively expensive, especially for small forest landowners.
Figure 2: Timber harvest and fire are two examples of how forest disturbance can release forest carbon, or sequester it in different forms.
The objective of our project is to develop a new approach to spatially predict and map forest carbon to help reduce the costs of forest carbon monitoring and allow small forest landowners to participate in carbon-trading markets. But why do we need a new approach to map forest carbon? There are already countless maps of forest carbon out there produced using a variety of different methods. Some incorporate state-of-the-art remote sensing data and advanced machine-learning methods. Others rely solely on field plot tree measurements to generate estimates of carbon storage for forests. Here are a few examples:
The objective of our project is to develop a new approach to spatially predict and map forest carbon to help reduce the costs of forest carbon monitoring and allow small forest landowners to participate in carbon-trading markets.
These examples demonstrate an ability to map forest carbon leveraging remote sensing data and field observations. What’s missing from these and most other forest carbon maps is an ability to characterize uncertainty in a way that is useful for forest carbon credit trading. To trade on the market, forest carbon needs to be estimated with statistical rigor, meaning that any estimates of carbon storage must have associated statistically-defensible uncertainty intervals (e.g., 95% confidence intervals or standard errors). Our mapping approach aims to address this issue by providing a mechanism to generate:
1) pixel-level uncertainty intervals for individual forest carbon predictions and
2) area-level uncertainty intervals for user-defined forest sections.
What’s missing from these and most other forest carbon maps is an ability to characterize uncertainty in a way that is useful for forest carbon credit trading. To trade on the market, forest carbon needs to be estimated with statistical rigor...
Methods
We obtained lidar data from the Minnesota statewide lidar collection . Lidar is able to measure the vertical structure of forests, making it one of the most useful remote sensing technologies available for forest carbon estimation. The 2011 lidar point cloud over the UMN Cloquet Forestry Center (CFC) was pre-processed, rasterized, and forest canopy heights were calculated (Figure 3). Preliminary model fitting exercises revealed that 95% relative (percentile) height was highly correlated to measurements of forest carbon derived from a network of continuous forest inventory (CFI) plots (Figure 4). As a result, we used the 95% relative height to develop the final spatial prediction model.
Figure 3: Map of forest canopy height produced from the 2011 statewide lidar collection for the UMN Cloquet Forestry Center (click map to enlarge).
Figure 4: Map of Continuous Forest Inventory (CFI) plots across the UMN Cloquet Forestry Center. These plots are where field measurements of biomass come from (click map to enlarge).
We developed a Bayesian hierarchical spatial model to relate the CFC field plot observations and lidar variables. We chose a Bayesian hierarchical spatial model for two reasons;
1) it provides excellent predictions when there is a strong relationship between the response and explanatory variables (e.g., field and lidar data) and
2) it provides a statistically rigorous avenue to generate uncertainty intervals for carbon predictions at a pixel level and for total (mean) carbon storage for any area-of-interest within the forest.
These are two key features needed (and often missing) for maps to be effectively used for forest carbon estimation in carbon trading markets.
Figure 5: Map of estimated biomass in tons per acre across the contiguous UMN Cloquet Forestry Center land base (click map to enlarge).
Figure 6: Using the bayesian hierarchical modeling framework we are able to also produce a map of our prediction uncertainty for every pixel in the UMN Cloquet Forestry Center (click map to enlarge).
Findings
Check out the interactive above ground carbon web map for the UMN Cloquet Forestry Center here (Figure 7). For research purposes, the web map carbon measurements are provided in metric tons per hectare (Mg/ha). For comparison, one metric ton / hectare equals 0.446 US ton / acre. View the video tutorial below that demonstrates how the interactive map works (Figure 8). We encourage you to view the tutorial and then explore the interactive map to generate estimates of forest carbon for areas within the CFC.
Figure 7: Example of above ground carbon data visualization with the webmap interface .
Figure 8: Chad Babcock, Assistant Professor with UMN Department of Forest Resources, provides a video tutorial on small area above ground biomass (AGB) estimation.
Why this project?
I [Ethan] have a background in forestry, as well as experience collecting forestry inventory information in the field with the United States Forest Service. As I was in the field collecting data, I was always curious about other approaches that can be used for forest measurements.
In my undergraduate degree I had acquired a professional certificate in Geographic Information Science (GIS) sparking an interest in pairing spatial and remote sensing data with forestry data to improve how we estimate forest inventory information.
This project is an excellent opportunity to expand my knowledge and explore my interest in remote sensing using forestry information.
Why the CFC?
The Cloquet Forestry Center is an excellent location for this research project due to the availability of forest inventory data. The CFC has a long term forest inventory project with permanent plots that have been measured since 1959 (Figure 9). This is one of the best long term forest inventory datasets available in Minnesota. The CFC being located in Minnesota also ensures that the site will have available Lidar data as part of the state’s initiative to provide every area of the state with lidar data. This historical dataset allows us to expand our project to see how carbon stocks have changed over time within the CFC.
Figure 9: UMN associate researcher Ray Jensen collects tree measurements at a CFI plot located at the UMN Cloquet Forestry Center ca. 1960s.
Project Feature Author: Ethan Emick, Research Assistant, Department of Forest Resources, University of Minnesota, emick003@umn.edu, LinkedIn .
Project Lead: Chad Babcock, Assistant Professor, Department of Forest Resources, University of Minnesota
Funding: This work is supported through the Minnesota Agricultural Research, Education and Extension Technology Transfer program (AGREETT) and NASA Carbon Monitoring System grants.


